
Maths
- Numbers & Numeration
- Indices & Logarithms
- Algebraic Equations
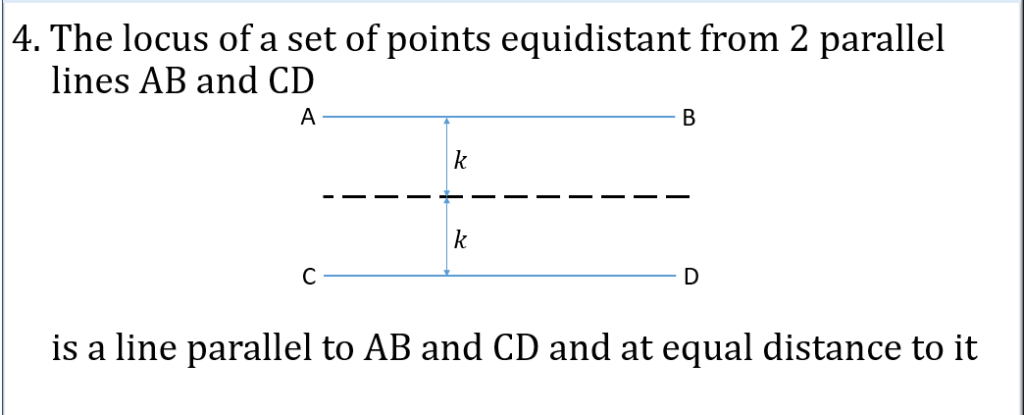
- Relations & Polynomials
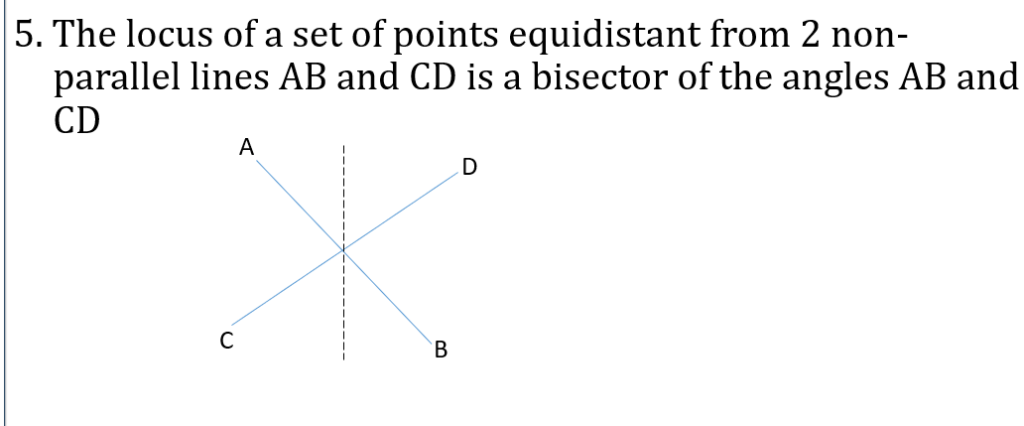
- Sequences & Series
- Inequalities
- Sets & Binary Operations
- Surds
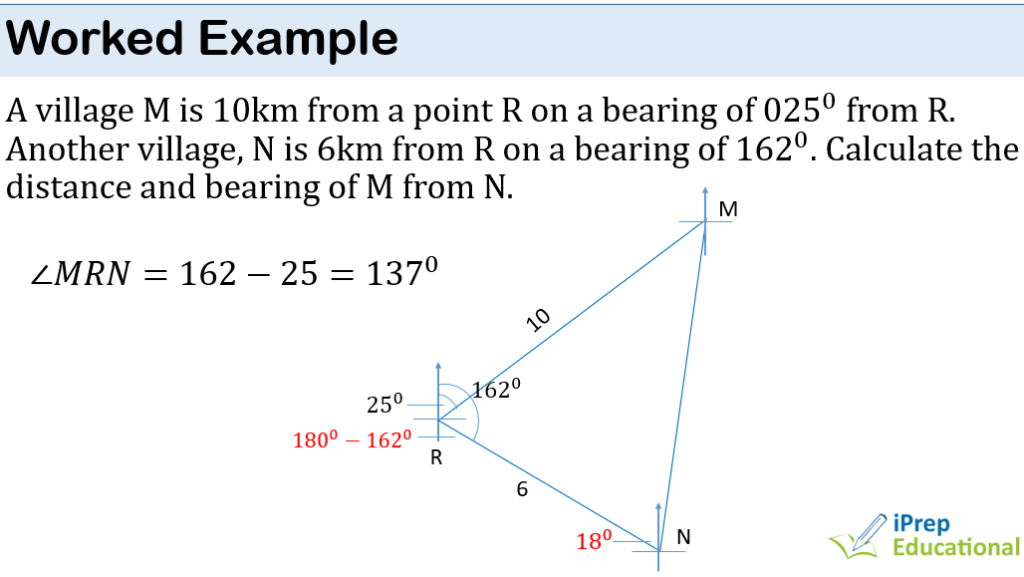
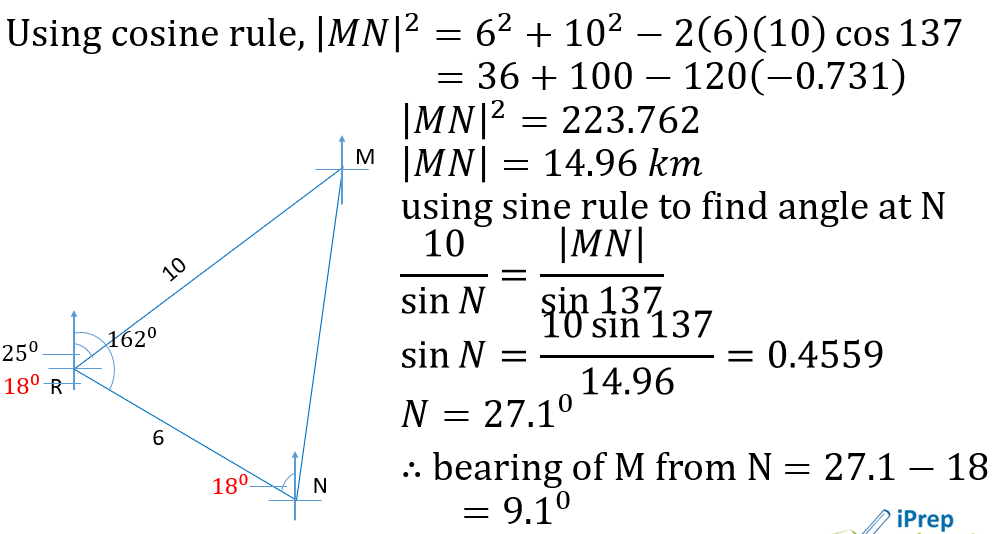
- Trigonometry
- Plane & Circle Geometry
- Graphing
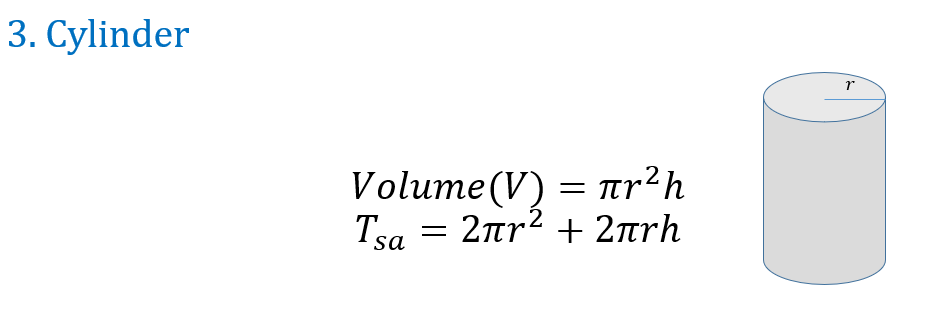
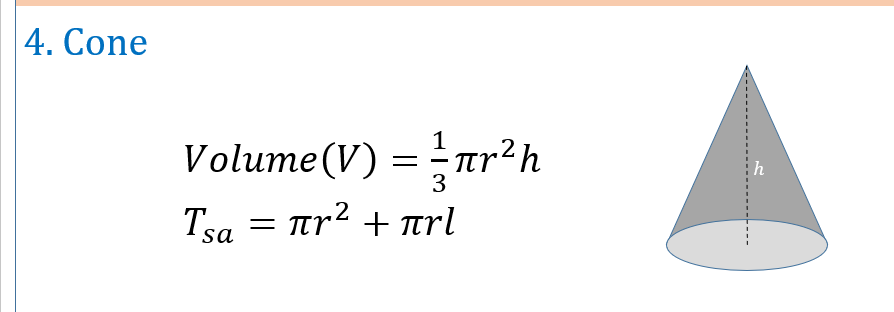
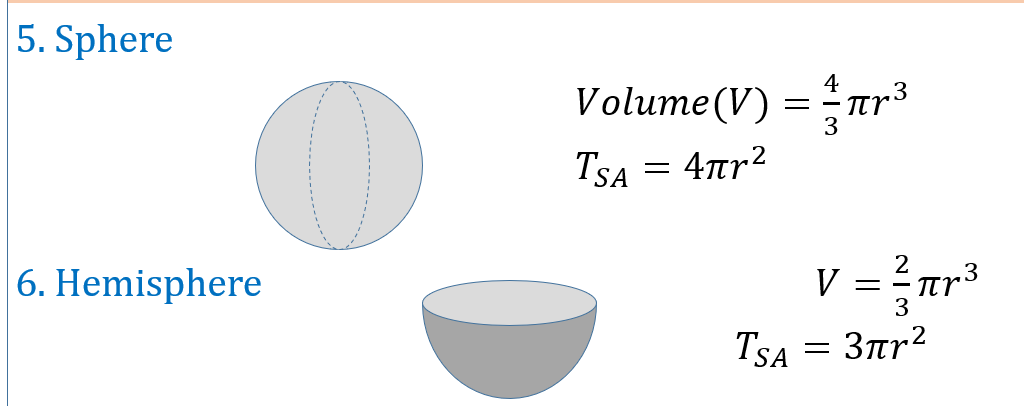
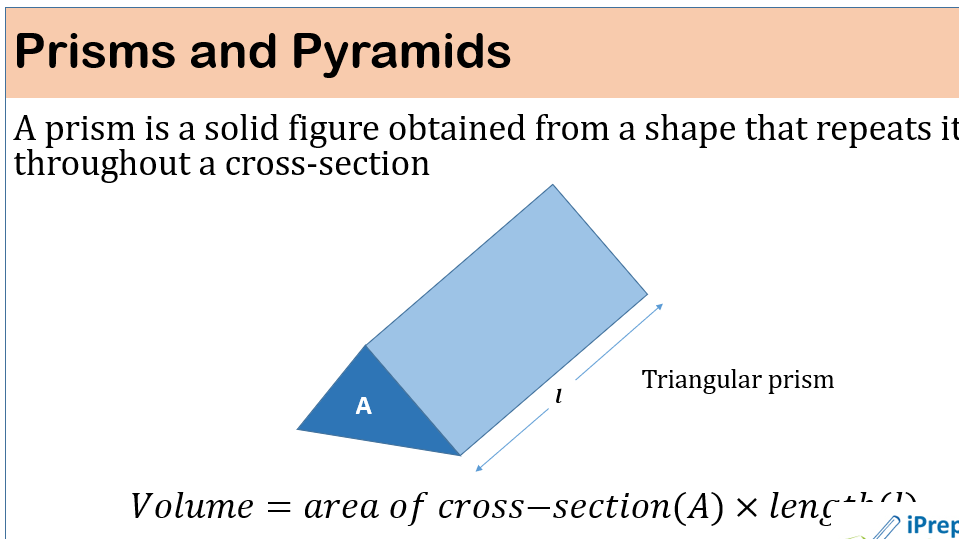
- Mensuration
- Coordinate & Transformation Geometry
- Loci & Construction
- Matrices & Determinants
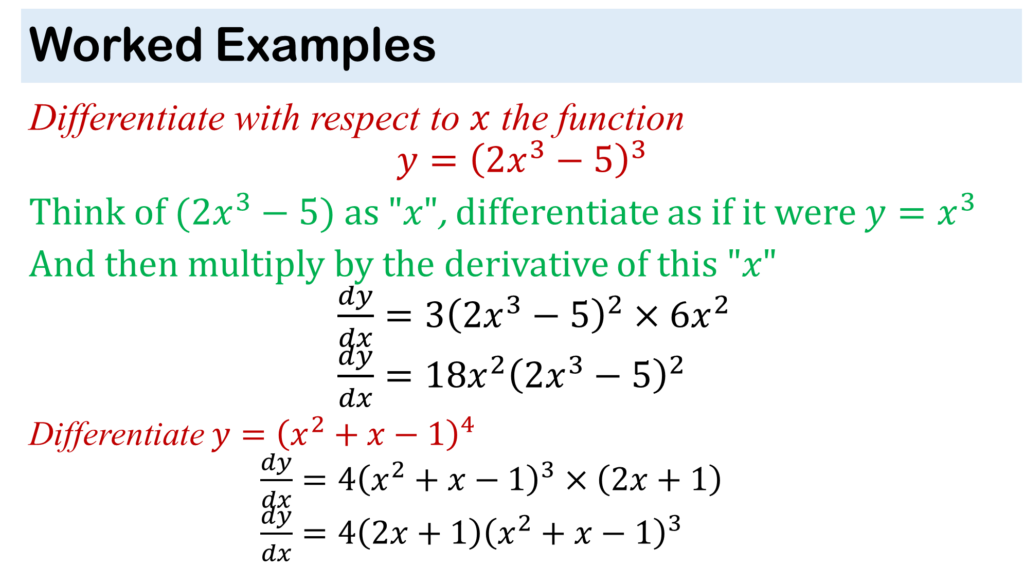
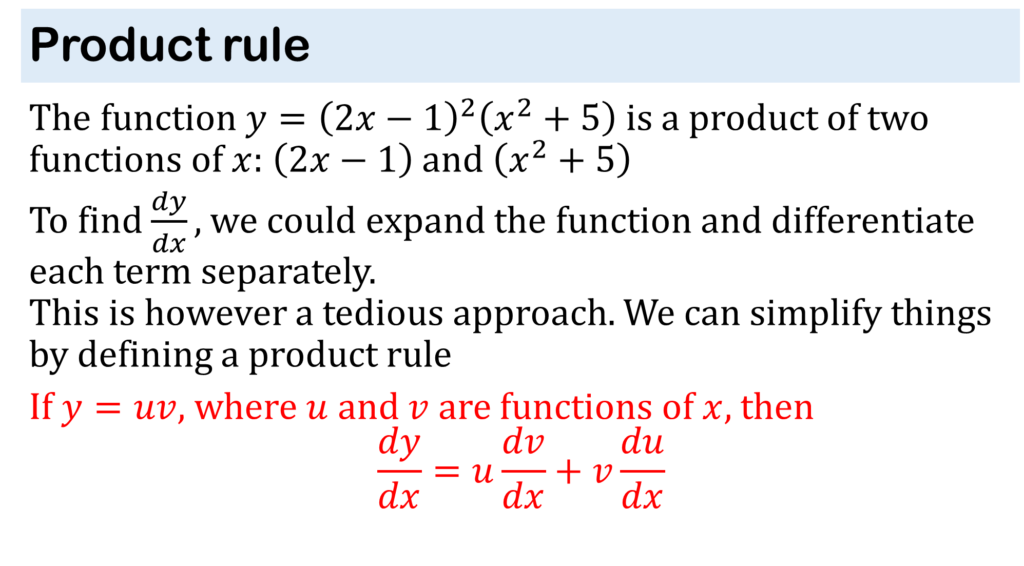
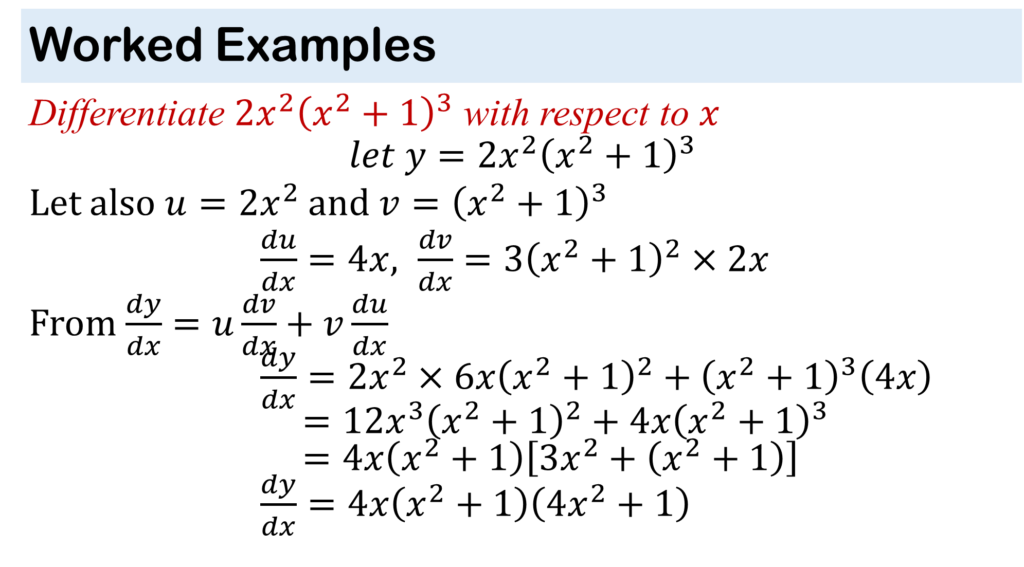
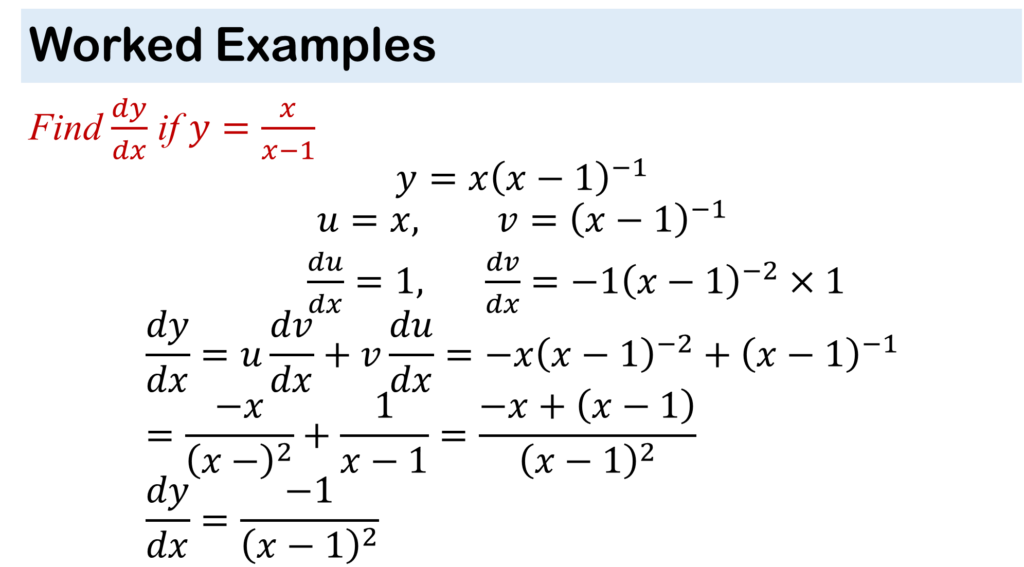
- Calculus I: Differentiation
- Calculus II: Integration
- Statistics
- Probability
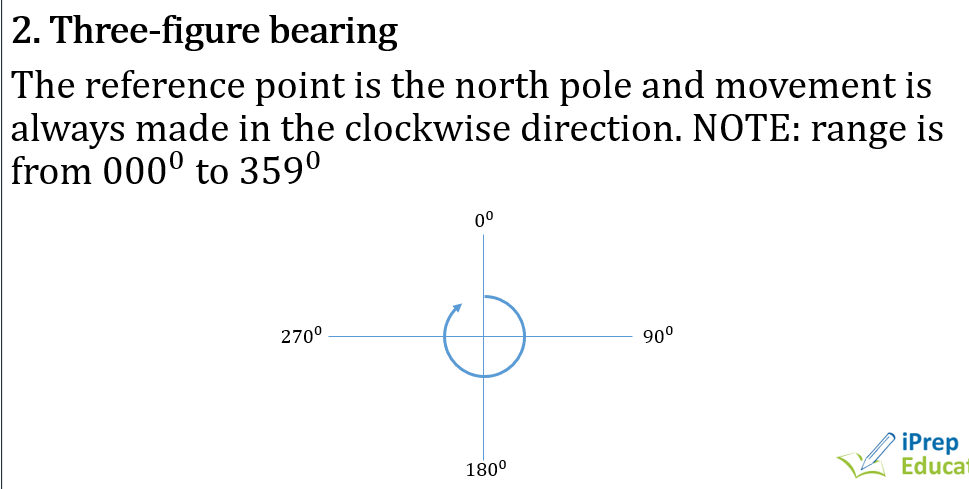
NUMBERS & NUMERATION
Introduction
Our first encounter with numbers were whole numbers, also called natural numbers and these were written down using numerals or digits.
There are 10 numerals: 0, 1, 2, 3, 4, 5, 6, 7, 8 ,9
The position of a numeral indicates the value it represents. For example,
384 stands for 3 hundreds, 8 tens and 4 units
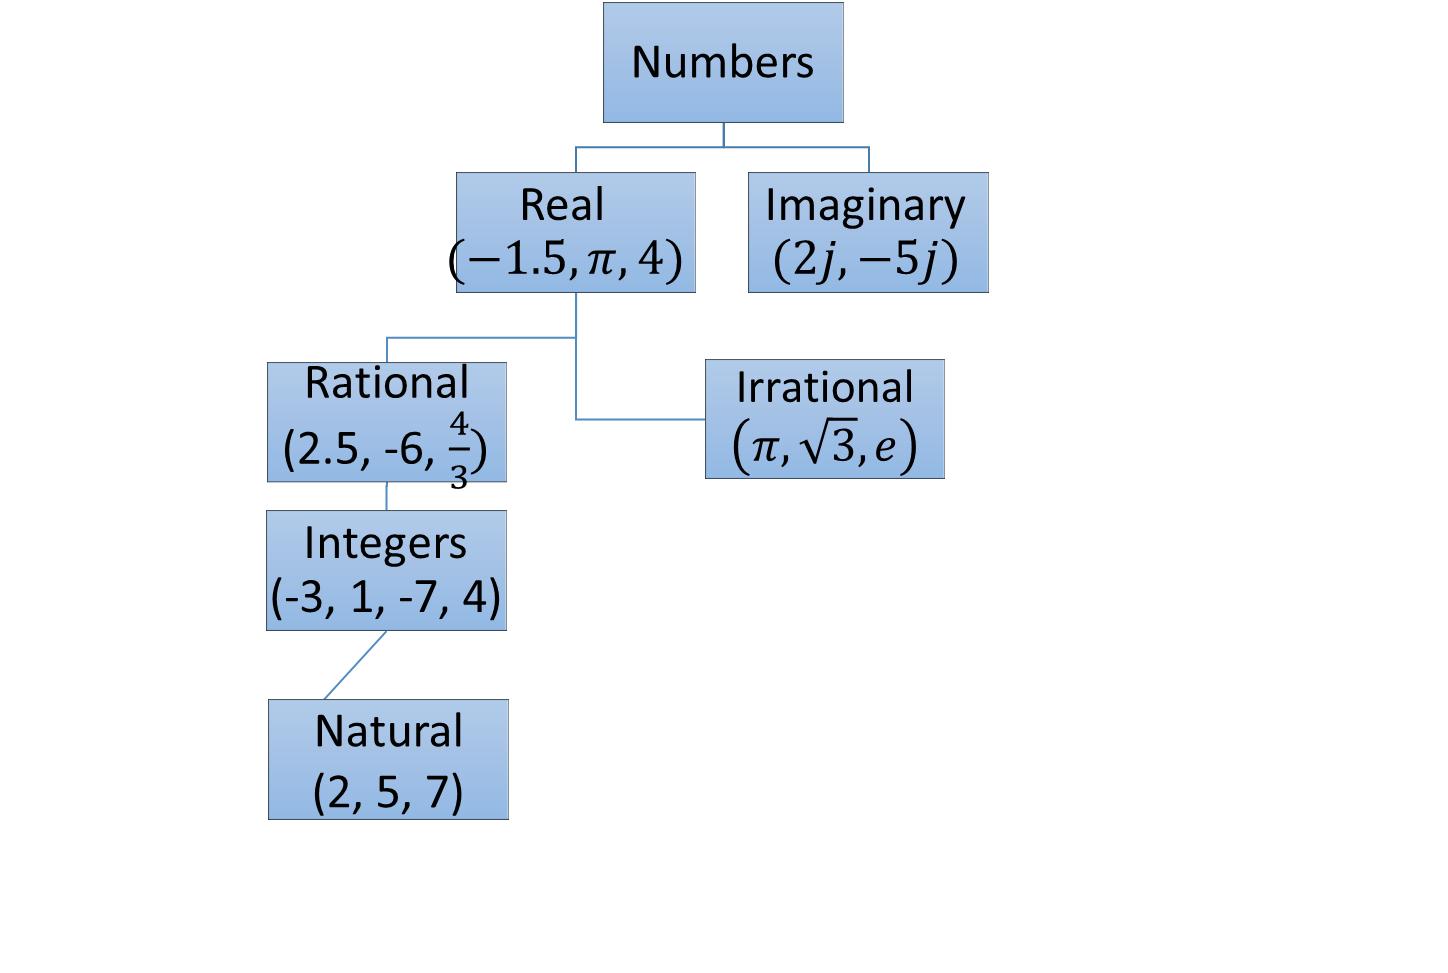
Types of Numbers
Natural Numbers
These are positive whole numbers such as 2, 16, 52, 483, etc
We use the symbol N to represent a set of natural numbers.
Integers
These are positive or negative whole numbers such as -3, 5, -19, -63
The symbol Z is used to represent integers
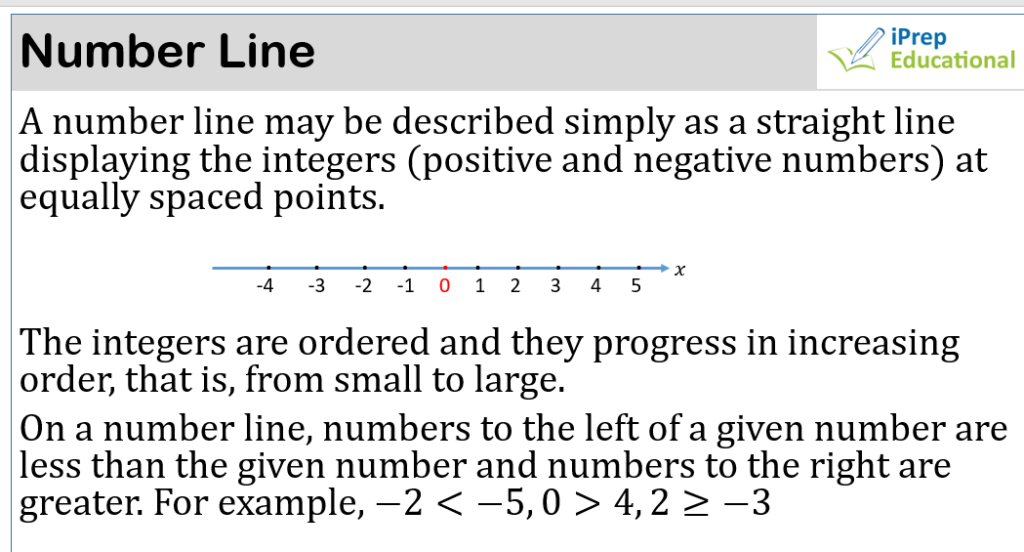
We can illustrate these two numbers on a number line.
A number line is a straight line displaying the integers at equally spaced points

Rational numbers
These are numbers that can be expressed as a fraction or written in the form a/b where a and b are integers and b is not equal to zero
For example, 1/2, 3/4, 0.5, -4/5, etc
The term rational is derived from the word ratio. We use the symbol Q to denote rational numbers.
Integers can be found in rational numbers because an integer like -4 can be expressed as -4/1
Irrational numbers
These are numbers that cannot be expressed as exact fractions. Irrational simply means “not ratio”. We can only give an approximate value of an irrational number as they are said to continue forever.
For example, √5 = 2.236067977… and it continues to as many decimal places as we can calculate
π = 3.141592654…
In calculations, we usually approximate π to 22/7, even though they are not actually equal
Real numbers
We define real numbers as numbers that can exist. It is therefore a combination of the four types numbers mentioned earlier
This makes the number line complete
Complex numbers
Consider this: what number can you multiply by itself to give -4, that is, what is √(-4)?
is it -2 or +2?
There is no real number that can solve this problem, hence the need to define a special type of numbers called complex number.
Directed Numbers
These are basically positive or negative numbers. For example,
1 1/3, -2.5, 3
When there is no sign before a number, it is taken to be positive. When we multiply two directed numbers, the sign multiplication shown must be adhered to.
(+) × (+) = +
(+) × (-) = –
(-) × (+) = –
(-) × (-) = +
The same rule applies when dividing
When adding or subtracting directed numbers, note the following
i) Two plus signs: add normally. For example, +3 + 5 = 8
ii) A plus and a minus: subtract normally but put the sign of the bigger number.
Examples: -5 + 2 = -3, 8 – 14 = -6, -13 + 18 = 5
iii) Two minus signs: add normally but put a minus sign,
Examples: -6 – 7 = -13, -23 – 4 = -27
Factors and Prime Numbers
A whole number which exactly divides into another whole number is called a factor
For example, 14 ÷ 7 = 2
7 is a factor of 14. 2 is another factor
14 is a multiple of 7
The factors of 18 are 2, 3, 6, 9
Each of these numbers can exactly divide 18 without any remainder
Example: What are the complete factors of 12, 54 and 19?
The factors of 12 are 1, 2, 3, 4, 6 and 12
The factors of 54 are 1, 2, 3, 6, 8, 18, 27, 54
The factors of 19 are only 1 and 19.
A whole number that has only two factors – 1 and itself – is called a prime number
2, 3, 5, 7, 11, 13, 17, 19 are some examples of prime numbers
Note that 1 is not a prime number
Thus, the prime factors of a number would be those factors that are prime numbers
HCF and LCM
The highest common factor, abbreviated as HCF, of two or more whole numbers is the largest factor they can have in common.
We obtain the HCF by expressing the numbers as a product of their prime factors
Example: What is the HCF of 12, 18 and 30?
12 = 2 × 2 × 3
18 = 2 × 3 × 3
30 = 2 × 3 × 5
HCF = 2 × 3 = 6
Example: What is the HCF of 84, 168 and 210?
84 = 2 × 2 × 3 × 7
168 = 2 × 2 × 2 × 3 × 7
210 = 2 × 3 × 5 × 7
HCF = 2 × 3 × 7 = 42
Lowest Common Multiple (LCM) is the smallest multiple that can exactly divide two or more numbers
Example: What is the LCM of 3, 4 and 6?
Repeatedly divide the numbers using small factors until we get to 1
| 3 | 4 | 6 | |
| 2 | 3 | 2 | 3 |
| 2 | 3 | 1 | 3 |
| 3 | 1 | 1 | 1 |
LCM = 2 × 2 × 3 = 12
Thus, 12 can divide 3, 4 and 6 without a remainder
FRACTIONS
When a number divides another number, we have a fraction or ratio.
A fraction is a number which is represented in the form a/b where a and b are integers.
a is the called the numerator while b is the denominator.
In the fraction 3/5, 3 is the numerator while 5 is the denominator
Fractions can be proper, improper or mixed.
Proper fraction: the numerator is less than the denominator. For example, 2/5, 4/7
Improper fraction: the numerator is greater than the denominator such as 12/5, 8/3
Mixed fraction: it is in the form of an integer and a proper fraction. For example, 1 1/2, 5 2/3
Fractions can be positive or negative
Simplifying fractions
Fractions like 2/4, 3/6, 8/16 and 1/2 all represent the same amount of 1/2. They are said to be equivalent fractions
To express a fraction in its lowest terms, we simply divide both numerator and denominator by their common factor.
2/4 = 1/2
Always express fractions in their lowest terms
Example: Express the following fractions in their lowest terms


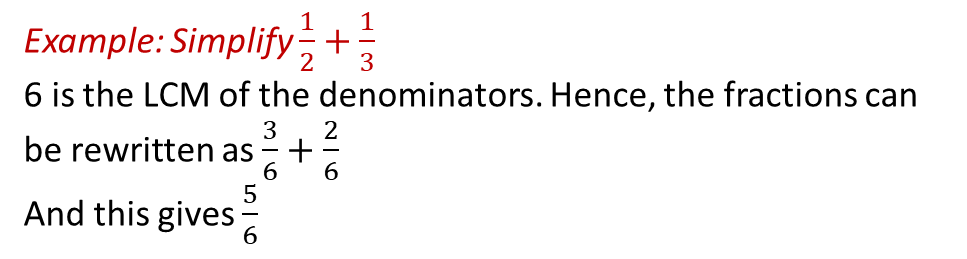
Adding and Subtracting Fractions
Two fractions can be added or subtracted together immediately if they have the same denominator.
Just add the numerators and divide by the common denominator. For example,

but if they don’t have a common denominator, they must be written in equivalent form with common denominators.
The common denominator can be gotten by finding the LCM of the original denominators
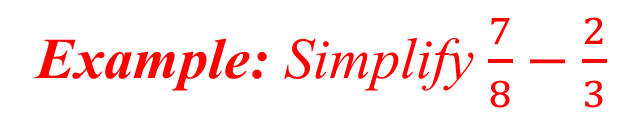
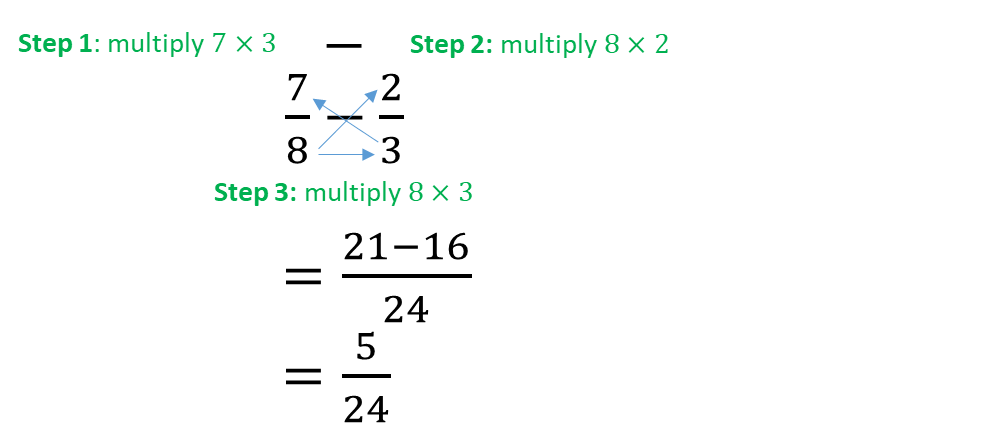
Quick method of adding or subtracting fractions
Multiplication of Fractions
Two or more fractions can be multiplied together by multiplying numerator by numerator and denominator by denominator

Remember to always express your final fraction answer in lower terms
Division of Fractions
To divide by a fraction, simply multiply by its reciprocal
The reciprocal of a fraction is obtained by just turning the fraction upside down.
The reciprocal of 3/4 is 4/3
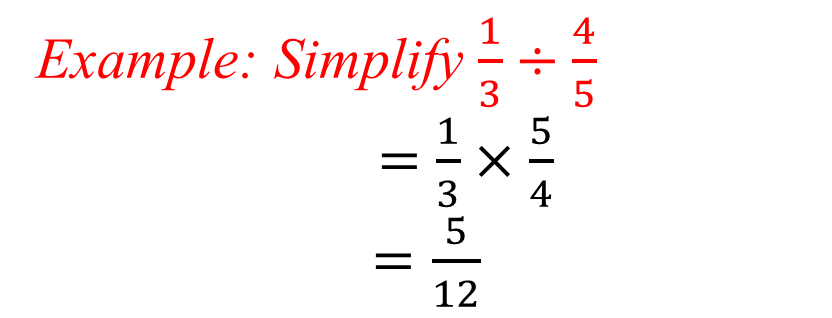
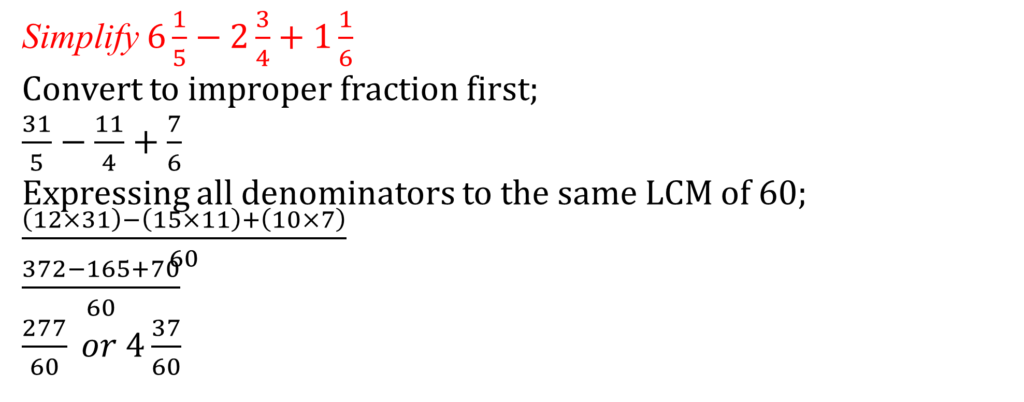
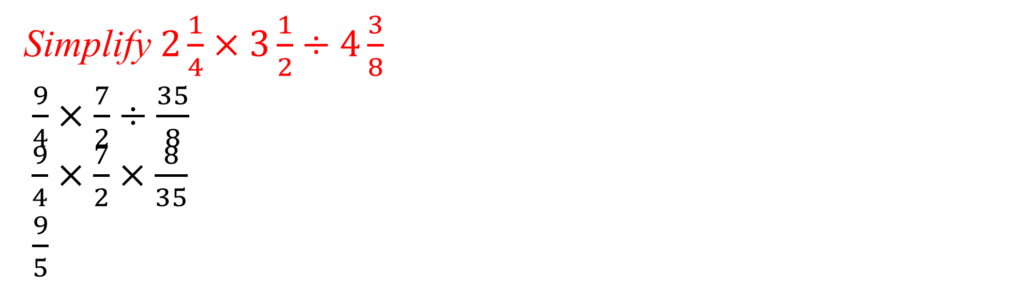
To divide by a mixed fraction, first change to improper fraction before multiplying by its reciprocal

WORKED EXAMPLES
Proportions and Ratios
If a whole number is separated into a number of fractional parts with each fraction having the same denominator as the others, then the numerators of the fractions form a ratio.
For example, if a sum of money is shared among three brothers in the ratio 2 : 3 : 5,
The sum of ratios gives the common denominator
The brother with the ratio 2 gets 2/(2+3+5) of the amount shared
If $10,000 was shared, then he gets 2/10 × 10000 = $2000
You probably now know the brother with ratio 3 gets
3/10×10000 = $3,000
While the last brother with ratio 5 gets $5,000
Notice that the sum of the amount each brother gets equals to the original amount of money shared
Example: Evaluate x if 45 : 72 = 40 : x
45/72 = 40/x
They are equivalent fractions if they have the same ratio
Cross-multiply: 45 × x = 40 × 72
x = (40 × 72)/45
x = 64
Example: A compound of mass 42g contains two elements A and B in the ratio 3:4. Find the amount of B in the compound
Amount of B = 4/(3+4) × 42
4/7 × 42 = 24
Therefore, the amount of B in the compound is 24g
Percentages
A percentage is a fraction whose denominator is 100.
For example, if 6 in 100 people in a place contracted Corona virus, it is written as 6% “six percent”.
If 35% of the students in a school are females, then, if there are 600 students, the number of females is
35/100 × 600
210 females
A fraction can be converted to a percentage by multiplying it by 100%
3/4 becomes 3/4 × 100% = 75%
Don’t forget to put sign “%”
INDICES & LOGARITHM
An index (plural: indices) is a number (written as superscript) that tells us how many times a term is being multiplied by itself.
For instance, we know that
23 = 2 × 2 × 2
2 is called the base
3 is the index or power or exponent
In order to perform calculations with indices, we need to be able to use the laws of indices in a variety of ways.
Laws of Indices
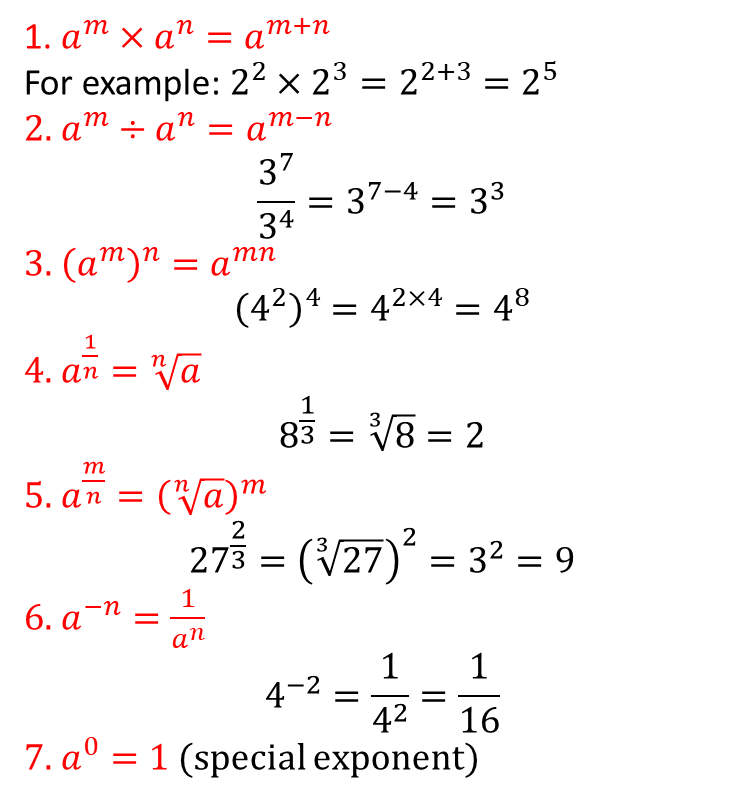
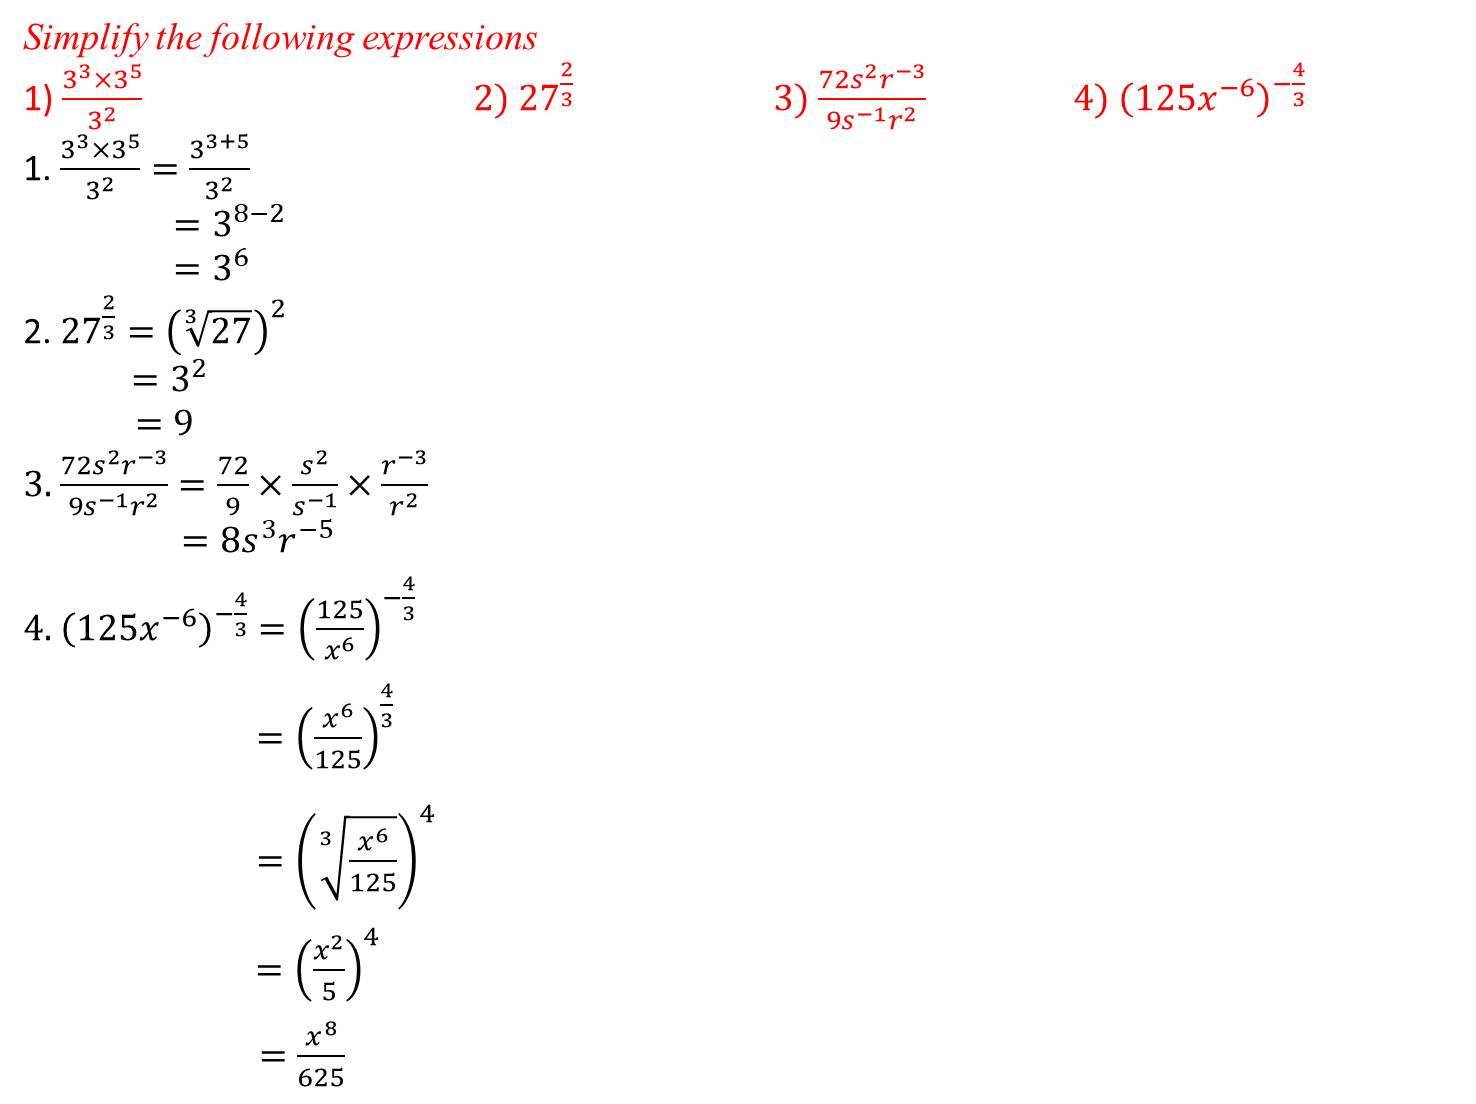
Worked Examples
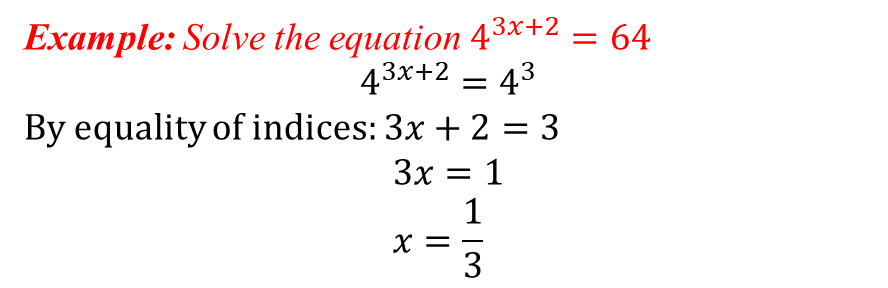
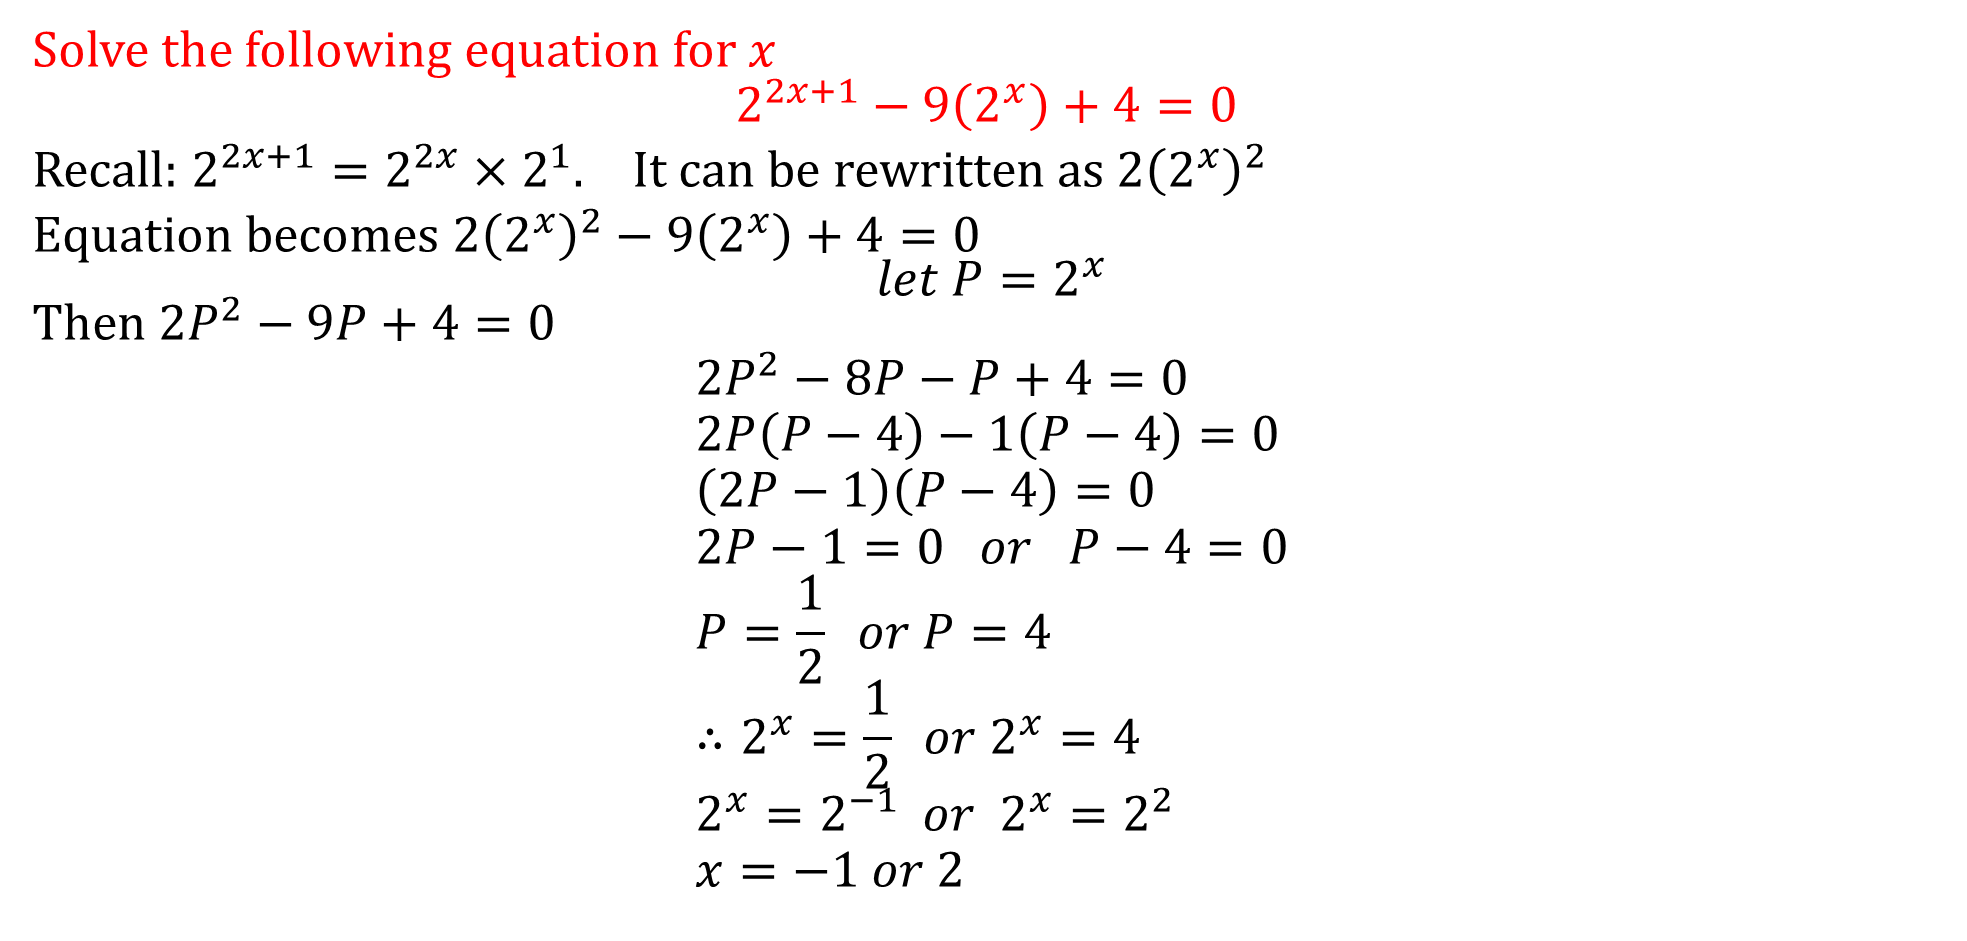
Exponential Equations
LOGARITHMS
Logarithms are closely related with exponential functions.
We know that 1000 is 10 raised to the power 3.
We say the “logarithm of 1000 to the base of 10 is 3” abbreviated as log101000 = 3
It appears that logarithm is another word for index.

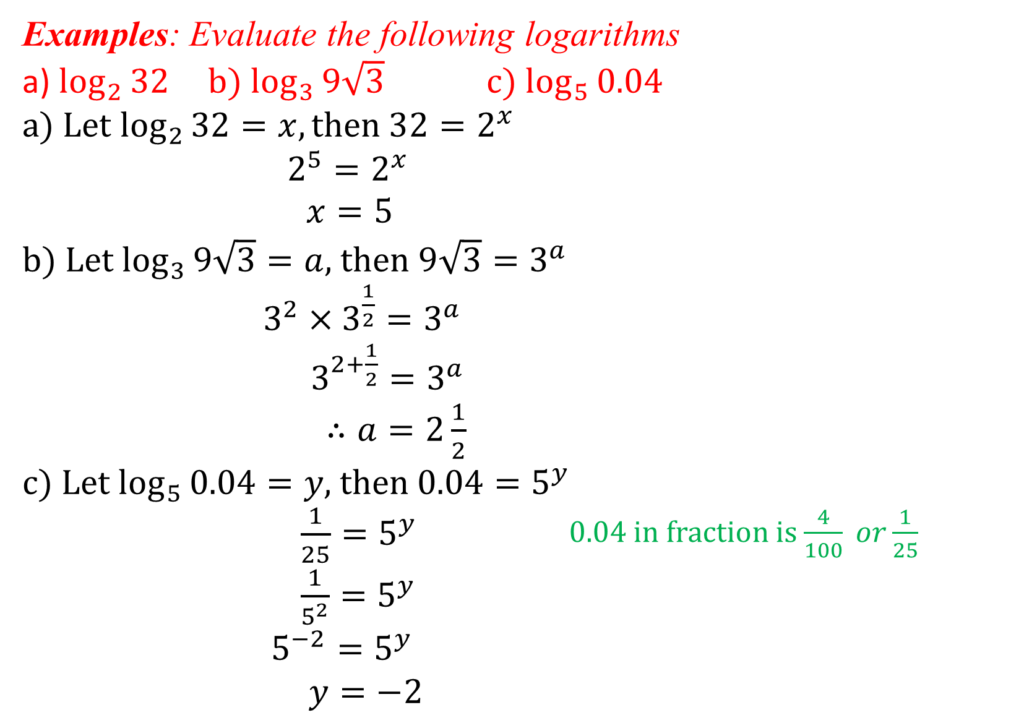
Thus, if 32 = 9, then 2 = log39
Again if 4 = logx32, then x4 = 32
If log264 = x, then 64 = 2x
and x = 6
With constant practice, you should quickly be able to convert from logarithm form to index form.
Logarithms used in calculations are normally expressed in base 10.
Logarithm used in calculations are normally expressed in base 10. They are called common logarithms
log101000 = 3 is written as log1000 = 3
Logarithms of numbers can be found using Tables or scientific calculators
How to Read Logarithm Tables
To find the logarithm of a number to base 10, we require two parts; characteristic (integer) and mantissa (decimal fraction).

The characteristic of a logarithm is the integral or whole number part.
It is determined by the careful observation of the index or power of 10 when expressed in standard form.
4852 = 4.852 × 10³
REMEMBER, a number is in standard form when it is expressed in the form A × 10n, where A is between 1 and 10 and n is an integer.
Shift the decimal point to a position where the number is now between 1 and 10
0.0052 = 5.2 × 10⁻³
If it shifts n-times to the right, n will be negative
87624 = 8.7624 × 10⁴
If it shifts n-times to the left, it will be positive
The characteristic of
• 346 is 2
• 14.87 is 1
• 40000 is 4
• 5.678 is 0
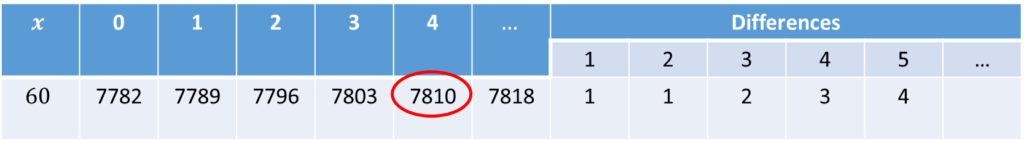
Next is to find the mantissa part from logarithm tables.
Trace the number 48 under 5. This gives 6857
Then trace the number in the differences column of “2” (still on the same row). This number is 2.
Add 2 to 6857 to give 6859
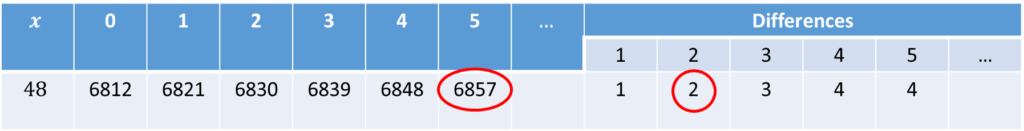
log 4852 = 3.6859
Logarithms of numbers less than 1
We use negative powers to find the logarithms of numbers less than 1
Example: What is the value of log 0.0604?
The characteristic is -2 (from 6.02 × 10⁻²)
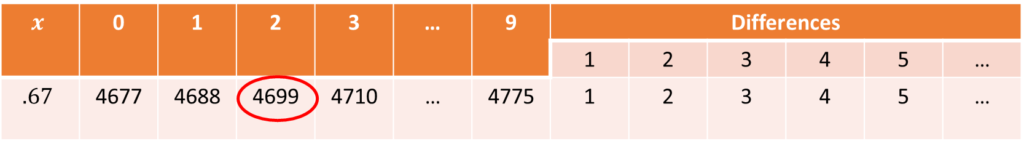
We get the mantissa part by checking the log. table, tracing “60“ under “4“ no differences
log 0.0604 = -2 + 0.7810
this will be written as 2 ̅.7810 (said as “bar 2 point 7810”)
NOTE that 2 ̅.7810 is not the same as -2.7810
The negative sign in 2 ̅.7810 only affects the characteristics 2
This is where the logarithm table differs from the scientific calculator. So for the purpose of examinations, make sure you use logarithm tables alone.
If you find the value of log0.0604 on the scientific calculator, you will get -1.2189630613788 (because the calculator has performed (-2+0.7810)
Antilogarithm
We can find the number whose log is given through the use of antilog tables
When finding the antilog, look up the decimal fraction part ONLY, then use the integral part + 1 to place the decimal point starting from the left.
Example: Find the antilog of 2.6725
The fractional part is .6725
We can check antilog tables for “.67” under “2” difference of “5”
Antilog tables
this gives 699 + 5 = 4704
the integral part is 2, we add 1 to make 3. This is a positive value, and we place the decimal 3 places to the right starting from the left
Thus, antilog 2.6725 = 470.4
Calculations Using Logarithms
Multiplication and division using Logarithms
The basic principle used here is based on the laws of indices
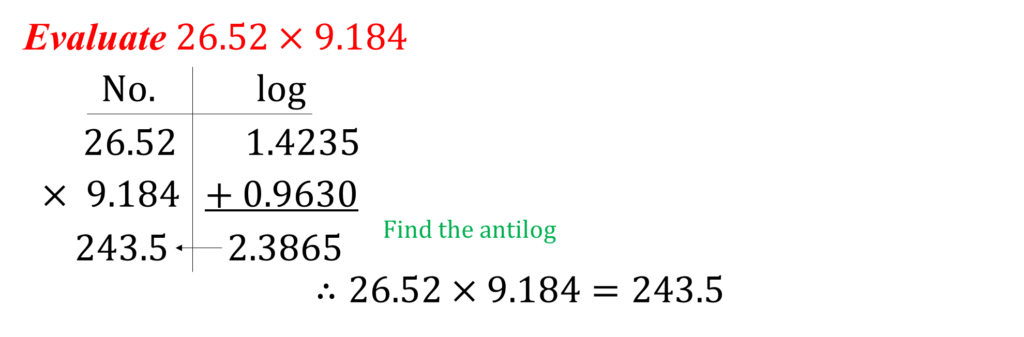
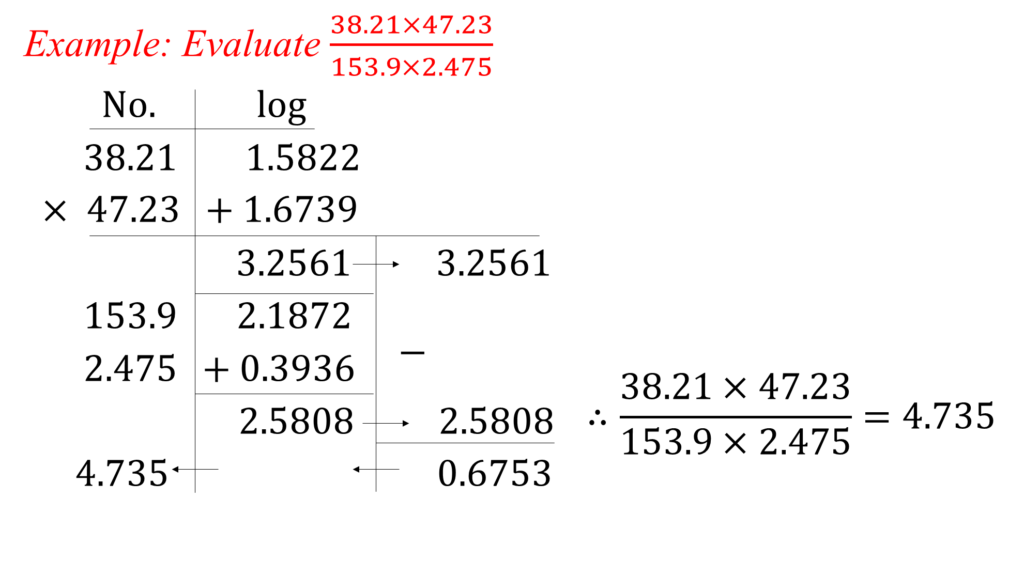
To multiply two or more numbers, add their logarithms and thereafter find the antilog
To divide two or more numbers, subtract their logarithms and thereafter find the antilog

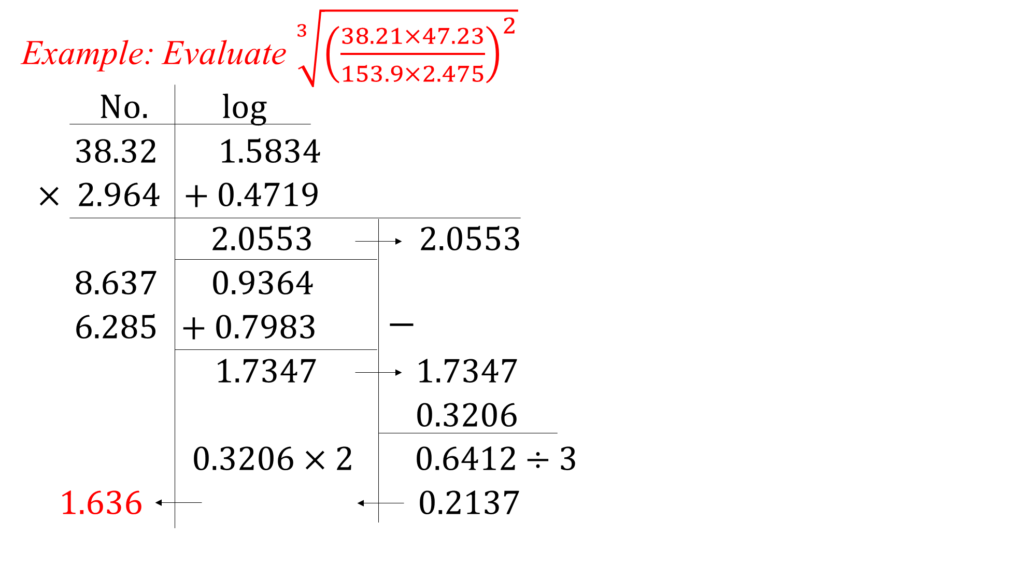
Powers and roots
To find the value of a number raised to a power is to find the logarithm of the number and multiply it by the power, then you find the antilog.
Example: What is the value of 63.853?

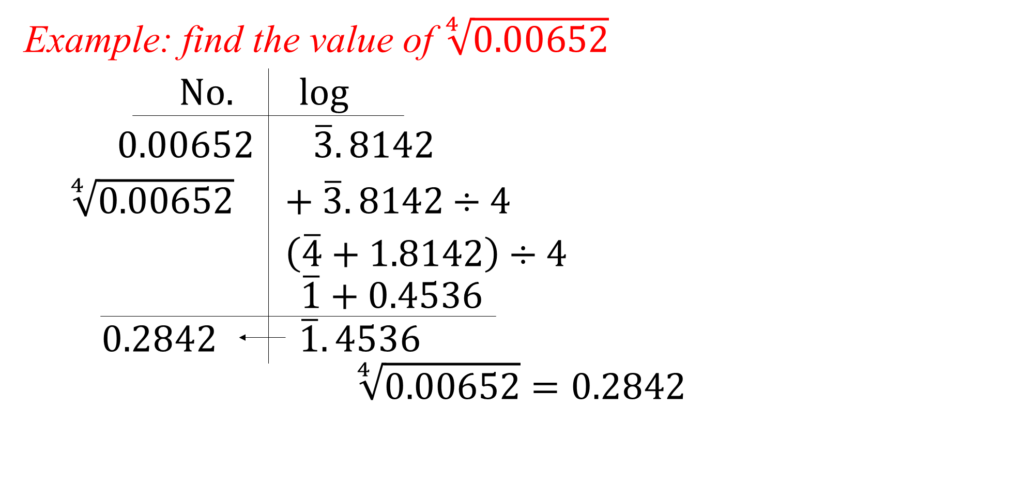
To find the nth root of a number, first find the logarithm of the number and then divide by n, thereafter find the antilog.

Calculation with numbers less than 1

Theory of Logarithms
We have studied standard logarithms, that is, logarithms to base 10.
However, logarithms can be in other bases
Recall that if loga y = x, then y = ax
Laws of Logarithms
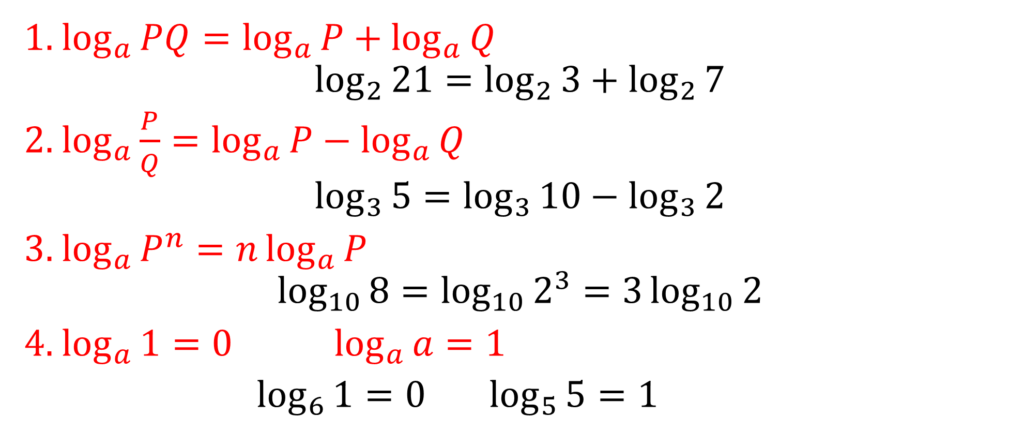
Example: Simplify log36 + log315 – log310
log36 + log315 – log310
= log3(6 × 15 ÷ 10)
= log39
= log332
= 2 log33
= 2
Common mistake: loga(P + Q) ≠ logaP + logaQ
Example: Given that log2 = 0.3010 and log 3 = 0.4771, evaluate without using tables or calculator
a) log6
b) log18
c) log15
a) log6 = log (2 × 3)
= log 2 + log 3
= 0.3010 + 0.4771
= 0.7781
b) log18 = log (9 × 2)
= log (32 × 2)
= log 32 + log2
= 2log 3 + log 2
= 2(0.4771) + 0.3010
= 1.2552
c) log 15 = log (30 ÷ 2) = log ((3×10) ÷ 2)
= log 3 + log 10 – log 2
= 0.4771 + 1 – 0.3010
= 1.1761
Practical Uses of Logarithm
1. Determination of magnitude of earthquakes
The magnitude of an earthquake is a logarithmic scale called ‘Richter Scale’, and it uses the formula
M = log10A + B
where A is the amplitude (in mm) measure on the Seismograph and B is a distance correction factor
2. Loudness of sound
Loudness is measured in Decibels, abbreviated as dB
Loudness in dB = 10 log10(p×1012)
where p is the sound pressure
3. Acidity of alkalinity
In chemistry, the acidity or alkalinity of a solution is measured on pH scale given by
pH = -log10[H+]
where [H+] is the hydrogen ion concentration
ALGEBRAIC EQUATIONS
An equation relates the variables with a definite value. It is a statement that 2 algebraic statements are equal in value.
For example, x + y = 2
Functions
A function may be defined as a set of rules that relates two or more variables
A function relates an input to an output. y = 2x + 3
Types of functions and equations
Linear function: The highest power of the variable or unknown is 1. For example, f(x) = 2x + 1
Sometimes when there is no function name, it is given a variable
y = 2x + 1
Linear equation: 2x + 1 = 5
Quadratic function: the highest power of the variable is 2
y = x2 + 2x – 3
Quadratic equation: x2 + 2x – 3 = 0
Polynomial function: the highest power of the variable is 2 or more e.g.
f(x) = 2x3 – 5x2 + x – 1
Polynomial equation: 2x3 – 5x2 + x – 1 = 2x – 7
Other types of functions include
Trigonometric function e.g. y = sin x
exponential function: y = 2x
Hyperbolic function: y = sinh x
Equations and Functions
An equation can be solved while a function cannot but can be used to find the set of value or images.
An expression on the other hand can only be simplified as it does not carry the equality sign (=).
These are examples of expression
2x2 + x + 6 – 5x2
7x(2x – 6) – 5(3x – 9)
Linear Equations
As earlier mentioned, in a linear equation, the highest power of the variable is 1.
e.g. 12x + 9 = x + 2
To solve an equation means to find a number that makes the equation true
In the simple linear equation: x + 2 = 5
The value of x that will make the equation true is 3 because 3 + 2 = 5
Example: Solve the equation 3x – 4 = 5
Using balance method, that is, carrying out the same mathematical operation on both sides such as adding, subtracting, dividing and multiplying by a number until only the unknown is on one side of the equation.
add 4 to both sides: 3x – 4 + 4 = 5 + 4
3x = 9
Divide both sides by 3: 3x/3 = 9/3
x = 3
Worked Examples
Simplify the following expressions
a. 2x – 3x + 5y – 8x
b. 2r – 3s – 3t – 3r + 10s + 8t
a. 2x – 3x + 5y – 8x
Collect the like terms (terms in x)
2x – 3x – 8x + 5y
-9x + 5y
b. 2r-3s-3t-3r+10s+8t
2r-3r-3s+10s-3t+8t
=-r+7s+5t
Example: Solve the equation: 2 = 5(5c – 2) – 9(3c – 2)
2 = 5(5c – 2) – 9(3c – 2)
2 = 25c – 10 – 27c + 18
2 = -2c + 8
2c = 8-2 = 6
c = 6/2 = 3
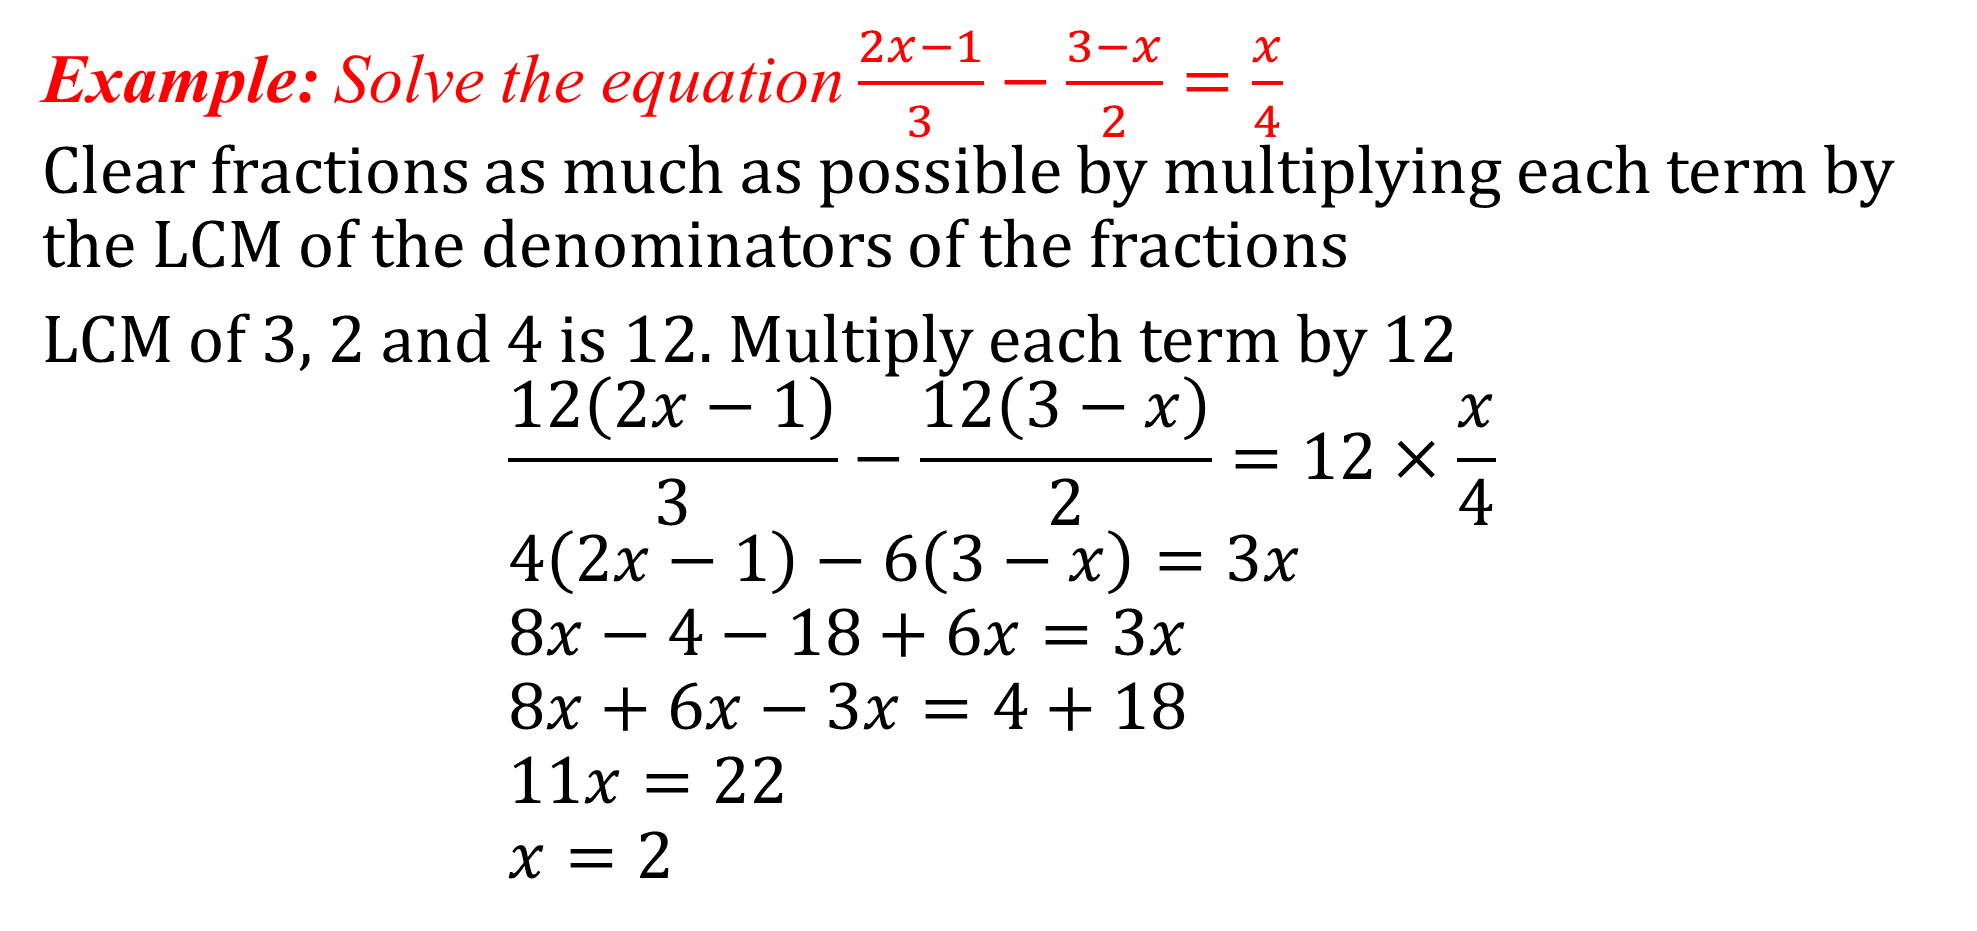
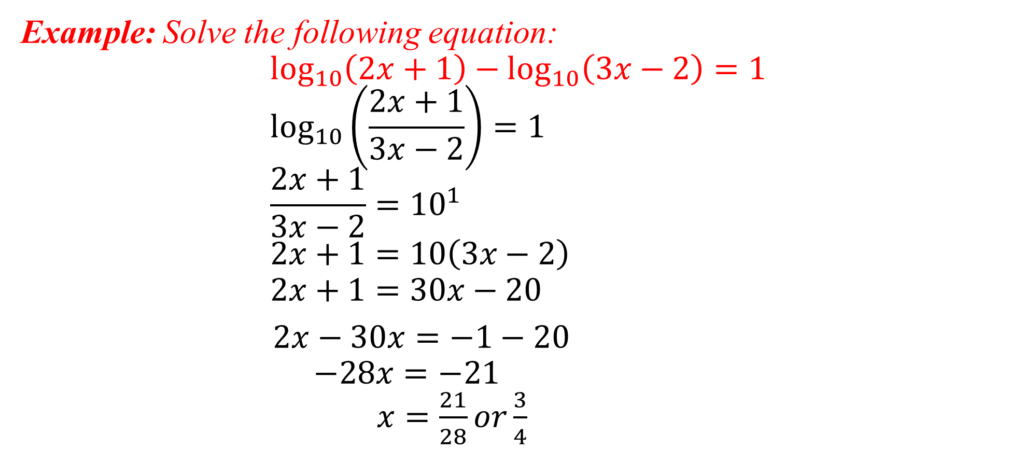
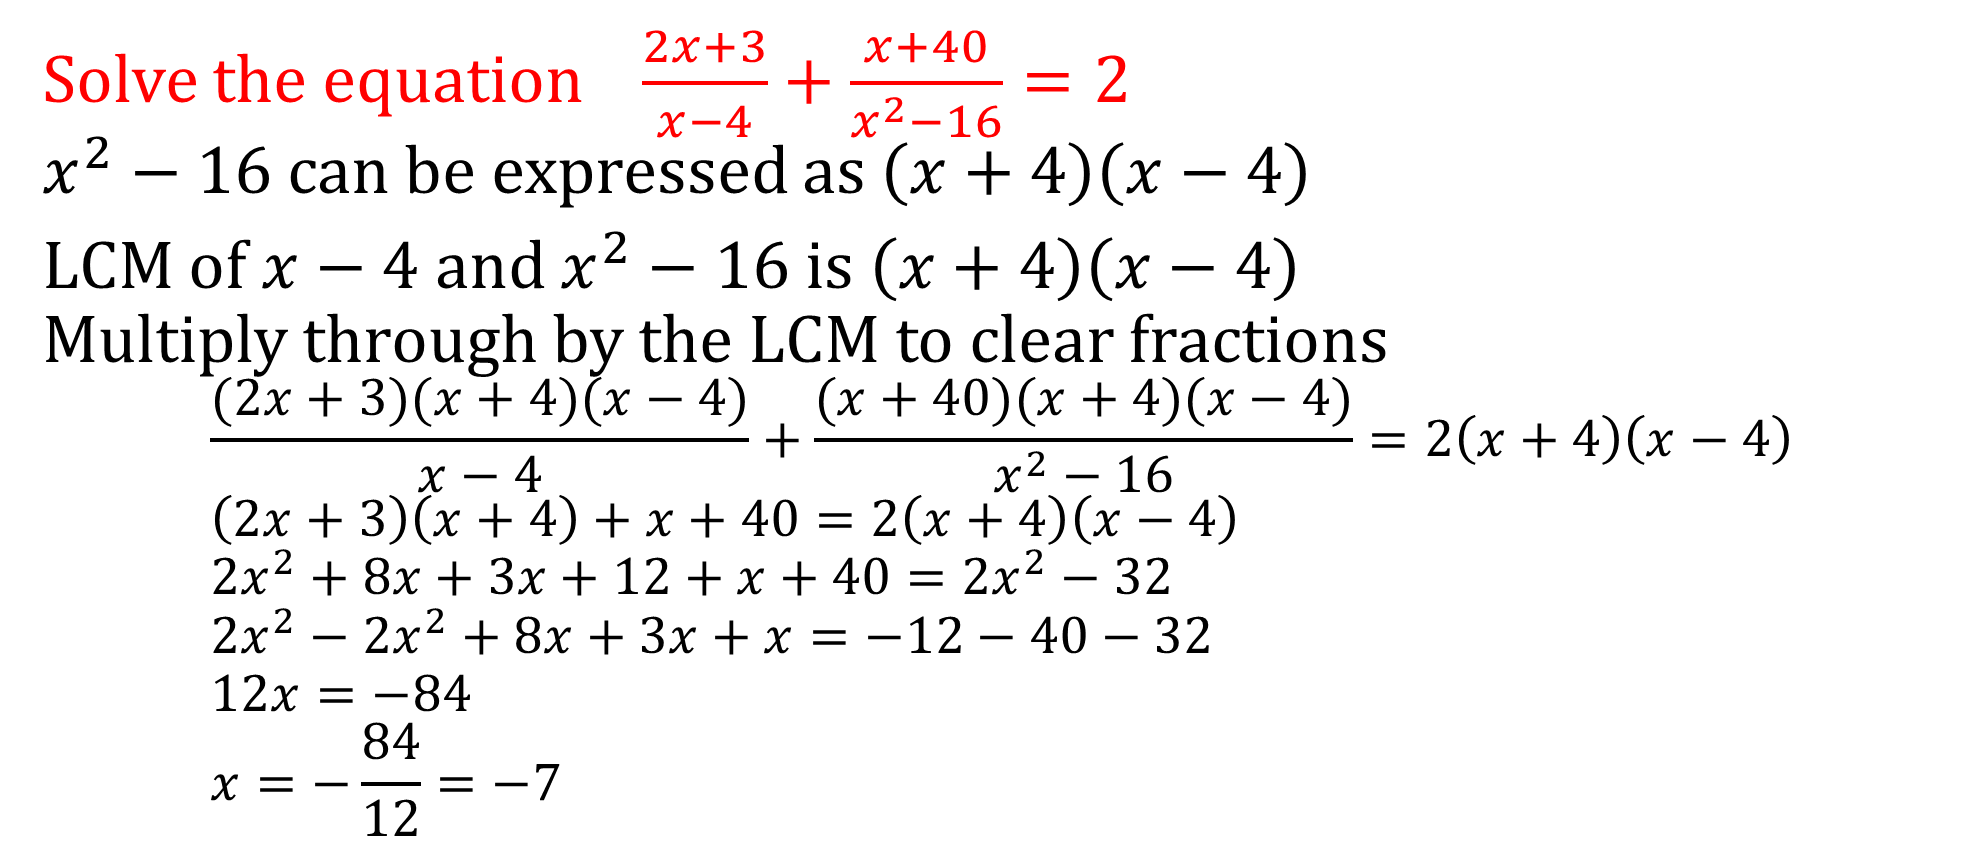
Equations with Fractions
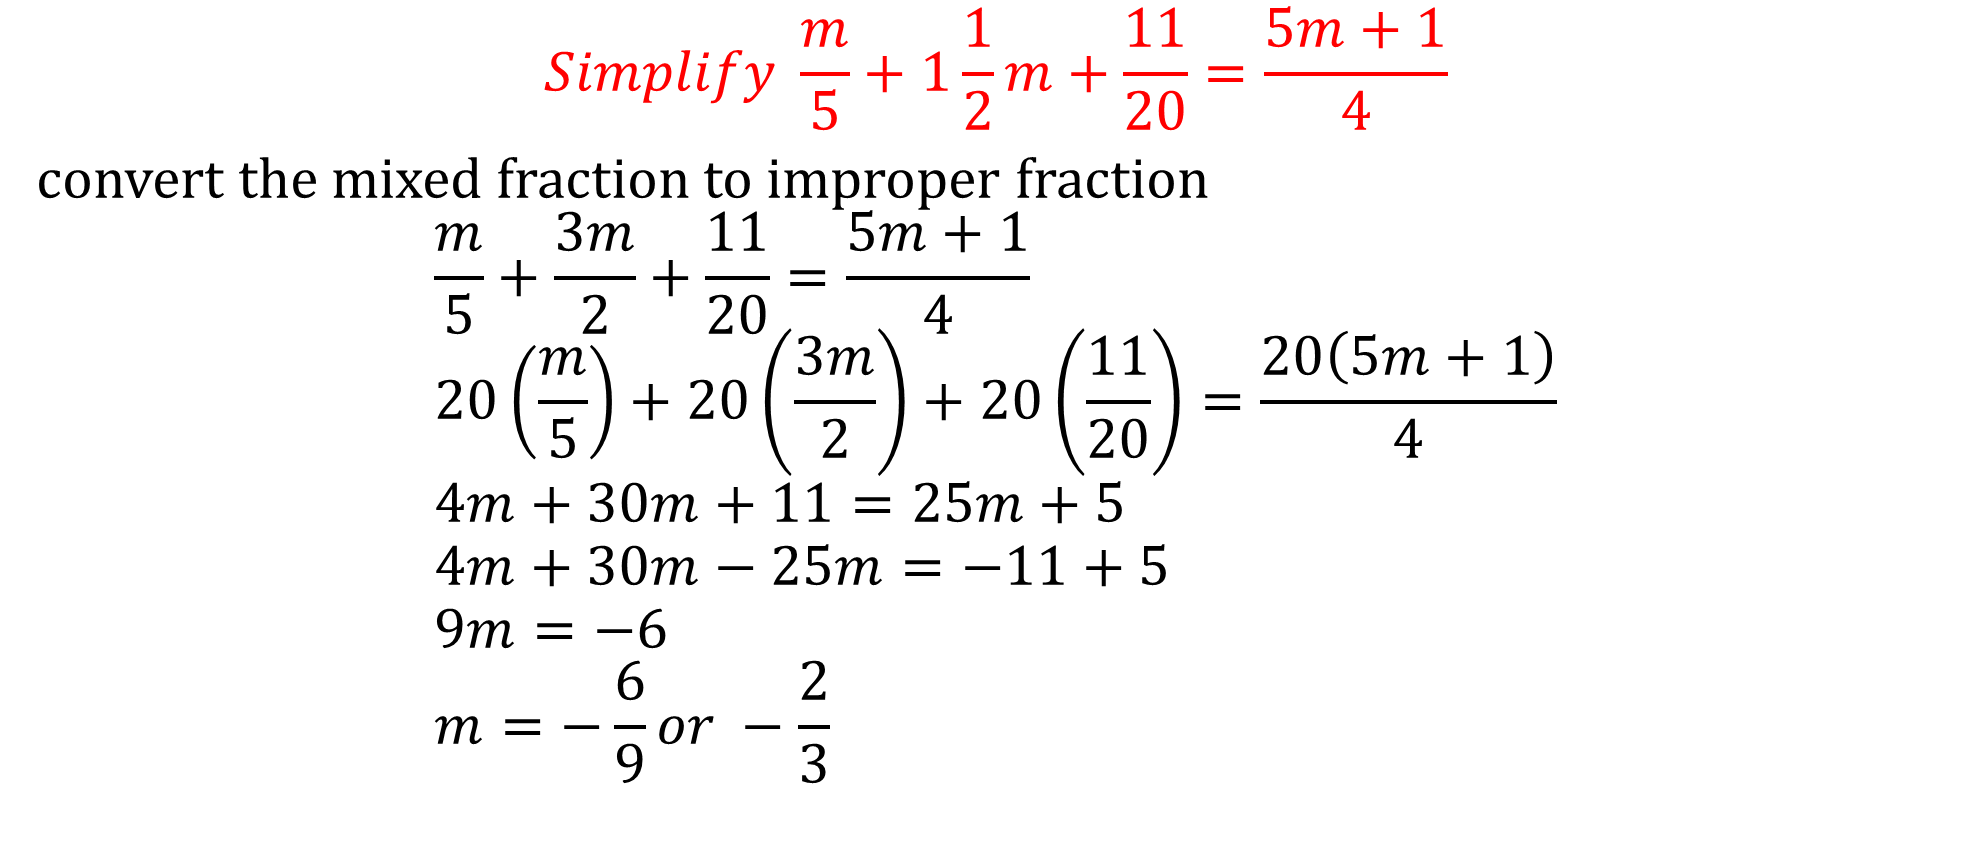
Useful tips in solving equations
• Clear fractions by multiplying by LCM (Lowest Common Multiple)
• Add or subtract the same value from both sides
• Divide both sides by the same non-zero value
• Collect/combine like terms
SIMULTANEOUS EQUATIONS
When solving an equation, the number of unknowns to solve for must be equal to the number of independent equations given.
Example: Solve the equations
3x – 2y = 5
2x + y = 7
We have 2 unknowns x and y, and we must be given at least 2 equations called simultaneous equations
There are several methods of solving simultaneous equations. They include substitution, elimination, graphical, determinant and matrix methods. Let’s discuss the first two
Substitution Method
Example: Solve the following equations
2x + y = 10
3x – 2y = 1
Under the substitution method, one of the two unknowns is made the subject of the equation. This is then substituted in the other equation to form a single equation with one unknown.
The value of this unknown is now substituted into any one of the two original equations to find the other unknown.
2x + y = 10 …(i)
3x – 2y = 1 …(ii)
make y the subject in equation (i):
y = 10 – 2x
substitute this into equation (ii):
3x – 2(10 – 2x) = 1
3x – 20 + 4x = 1
3x + 4x = 1 + 20
7x = 21
x = 3
Substitute this value of x into equation (i) [or (ii)]
2(3) + y = 10
y = 10 – 6 = 4
x = 3, y = 4
Elimination Method
Solve the equations
4x + 6y = 21
7x – 3y = 3
In elimination method, we make the coefficients of the variable we want to eliminate equal in both equations by multiplying suitable constants,
then add (or subtract) both equations to form a simple equation with only one unknown.
If we choose to eliminate x, we see the coefficient of x in the first equation is 4 and 7 in the second equation. The LCM of these numbers is 28.
To make the coefficients of x in both equations equal to the LCM, multiply eqn. (i) by 7 and eqn. (ii) by 4
4x + 6y = 21 …(i) × 7 → 28x + 42y = 147
7x – 3y = 3 …(ii) × 4 → 28x – 12y = 12
subtract to eliminate x: 0 + 54y = 135
y = 135/54 or 5/2
Now substitute this value of y into any of the original equations. Using equation (ii): 7x – 3(5/2) = 3
7x – 15/2 = 3
7x = 3 + 15/2 = 21/2
x = 21/2 × 1/7 = 3/2
x = 3/2 and y = 5/2
QUADRATIC EQUATIONS
In this type of equation, the highest power of the variable is 2. For example, x2 + 5x + 6 = 0, 5a+2ab = 3b2
The standard form of a quadratic equation is ax2 + bx +c = 0 where a ≠ 0
a, b and c are constants
a is the coefficient of x2
b is the coefficient of x
c is the constant term
Methods of Solving Quadratic Equations
- Factorization method
- Completing the square method
- Quadratic formula
- Graphical method
FACTORIZATION METHOD
x2 – 5x – 6 = 0
Steps to solve a quadratic equation by factorization
1. Multiply the coefficient of x2 by the constant term
(1) × (-6) = -6
2. Look for two factors of the result above such that the sum will be the coefficient of x and the product will be what you obtained in (i)
Two factors are -6 and +1 because product gives (-6) × (+1) = -6 AND sum gives (-6) – (+1) = -5
3. Replace the coefficient of x with the two factors found
x2 – 6x + x – 6 = 0
4. Factorize in twos:
x(x – 6) + 1(x – 6) = 0
(x – 6)(x + 1) = 0
5. Equate each term to 0
x-6 = 0 or x + 1 = 0
x = 6 or x = -1
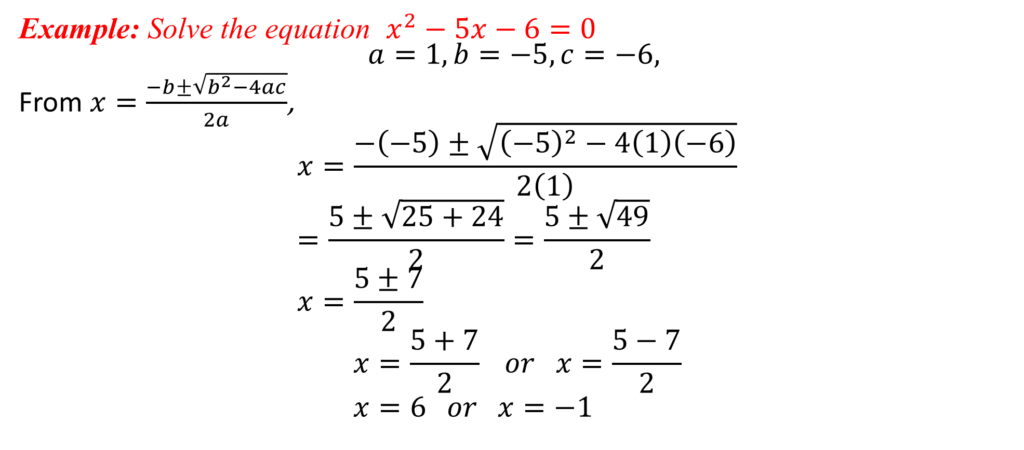
QUADRATIC FORMULA
Given the general form of a quadratic equation as ax2 + bx + c = 0

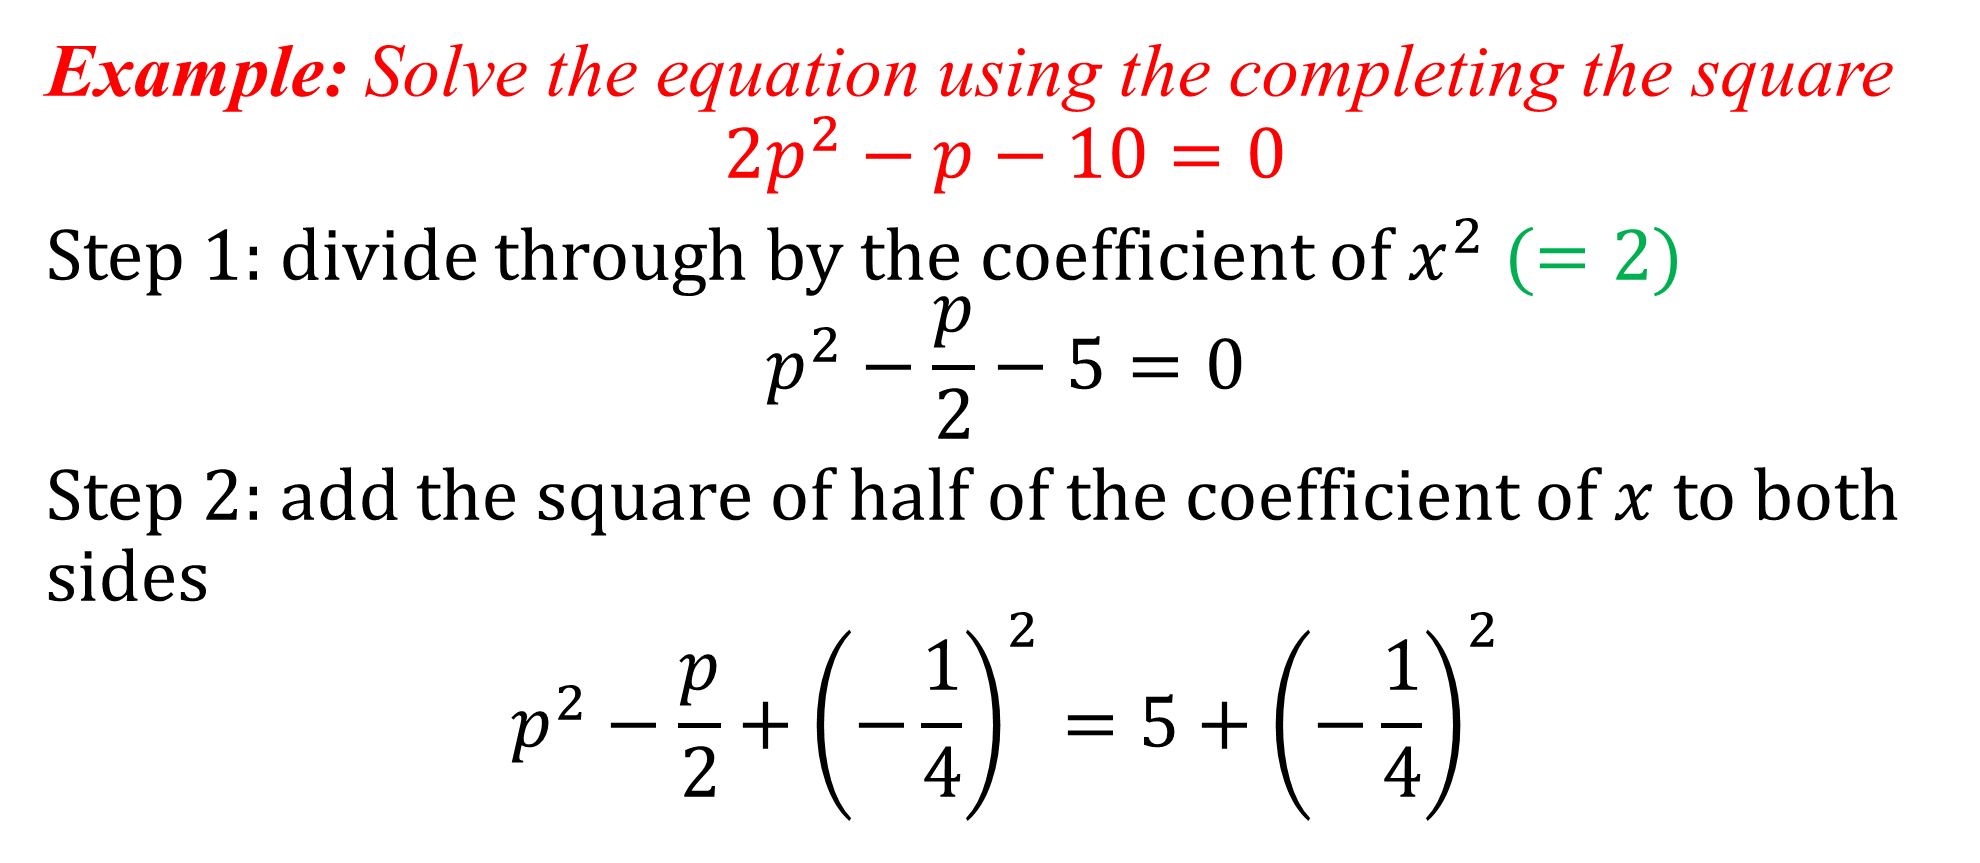
COMPLETING THE SQUARE

Difference of 2 squares
a2 – b2 = (a + b)(a – b)
Example: a) Simplify the expression x2 – 9 and hence solve the equation 2x2 – 18 = 0
b) Find the value of 552 – 152 without the use of a calculator
Using difference of two squares, x2 – 9 can be expressed as x2 – 32
(x + 3)(x – 3)
Hence 2x2 – 18 = 0 becomes 2(x2 – 9) = 0
2(x + 3)(x – 3) = 0
x = -3 or x = 3
b) 552 – 152 = (55 + 15)(55 – 15)
= (70)(40)
= 2800
Simultaneous and Quadratic Equations
Let’s examine simultaneous equations where one is linear and the other is quadratic
Example: Solve the equations
3x + y = 25 …(i)
xy = 8 …(ii)
Substitution method is the only usual method to use here, and it is more convenient to substitute the linear equation.
From eqn. (i), y = 25 – 3x
substitute into eqn. (ii): x(25 – 3x) = 8
25x – 3x2 = 8
3x2 – 25x + 8 = 0
3x2 – 24x – x + 8 = 0
3x(x – 8) -1(x – 8) = 0
(3x – 1)(x – 8) = 0
x = 1/3 or x = 8
Substitute for x in eqn. (ii)
when x = 1/3, (1/3)y = 8, and y = 24
when x = 8, 8y = 8 ⇒ y=1
Solution: (1/3, 24) and (8, 1)
Roots of a Quadratic Equation
Constructing a quadratic equation
Sometimes we are required to construct the quadratic equation from the given roots. Recall that roots are the two values of x you get when you solve a quadratic equation
Example: find a quadratic equation in x whose roots are +5 and +7
Method 1:
Since the roots are +5 and +7, it follows that x=5 or x=7 are the solutions of the quadratic equation, and were obtained from
(x – 5)(x – 7) = 0
x2 – 5x – 7x + 35 = 0
x2 – 12x + 35 = 0
Method 2: it involves the use of a formula
x2 – (sum of roots)x + product of roots = 0
x2 – (5 + 7)x +(5 × 7) = 0
x2– 12x + 35 = 0
WORD PROBLEMS
Mathematics isn’t all about figures. Some statements when interpreted give rise to equations which may be linear, quadratic, etc.
Statement: Ade is twice as old as Funke
Interpretation: Ade = 2 × Funke
or a = 2f
Where a and f represent the ages of Ade and Funke respectively
Statement: Tunde has N5000 more than Shola
t = 5000 + s
where t and s represent the amounts Tunde and Shola have respectively
The key to solving word problems is to break each sentence into equations and thereafter apply the relevant technique to solve.
Example: Four knives and six forks cost N700; six knives and five forks cost N800. Find the cost of a knife and a fork
Let the cost of a knife be k and a fork be f
Tip: use first letters in these type of questions so as know instantly what it represents
1st statement: 4k + 6f = 700…(i)
2nd statement: 6k + 5f = 800…(ii)
This is a simultaneous equation. And using elimination method,
eqn. (i)×3: 12k + 18f = 2100
eqn. (ii)×2: 12k + 10f = 1600
subtract: 8f = 500
f = 500/8 =62.5
Substitute f = 62.5 in eqn. (ii): 6k + 5(62.5) = 800
6k + 312.5 = 800
6k = 487.5
k = 81.25
Hence a knife cost N81.25 while a fork cost N62.50
Example: A two-digit number is such that its tens digit is greater than its unit digit by 3. The two digit number is less than three times the product of its digit by 35. Find the number
Let the digit be t and u
The number which will be written as ‘tu’ is 10t + u
1st sentence: t = u + 3…(i)
2nd sentence: 3tu – [10t + u] = 35…(ii)
3u(u + 3) – [10(u + 3) + u] = 35
3u2 + 9u – [10u + 30 + u] = 35
3u2 + 9u – 10u – 30 – u – 35 = 0
3u2 – 2u – 65 = 0
3u2 – 15u + 13u – 65 = 0
3u(u – 5) + 13(u – 5) = 0
(3u + 13)(u – 5) = 0
3u + 13 = 0 or u-5 = 0
u = -13/3 or u = 5
u = -13/3 cannot be a solution because the number cannot be negative or a fraction
Thus, when u = 5, t = 5 + 3 = 8
The number therefore is 85
Example: Given a rectangle as shown below with its dimensions in cm, find
a) The values of x and y (b) the dimensions
c) the area of the rectangle

In a rectangle, opposite sides are equal
∴2x = x + y + 1
3y + 2 = x + 7
Collecting like terms in both equations and arranging: 2x – x – y = 1 → x – y = 1 … (i)
-x + 3y = 7-2 → -x + 3y = 5 …(ii)
eqn. (i) + (ii): 2y = 6
y = 3
when y = 3, eqn. (i) becomes x – 3 = 1
and x = 4
b) Substituting for the dimensions:
length is 2x = 2 × 4 = 8
breadth is x + 7 = 11
c) Area = length × breadth = 11 × 8
= 88 cm2
RELATIONS & POLYNIMIALS
Introduction
A relation is a rule that connects the elements of two sets: domain (input) and co-domain or range (output).
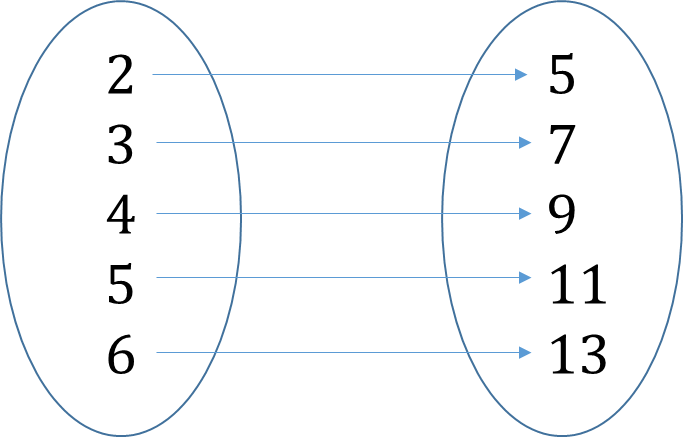
The arrow diagram, also called a mapping diagram, is used to show a relation. An element in the domain may have one or more images in the co-domain.
Types of Relations
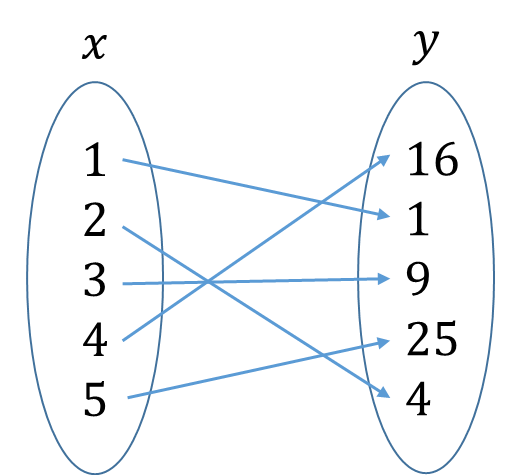
1. One-to-one: Each element or input in the domain is mapped to only one image in the co-domain and each output element has only one input element.
For example, if x is a set of numbers from 1 to 5 and y=x^2, then the relation is one-to-one
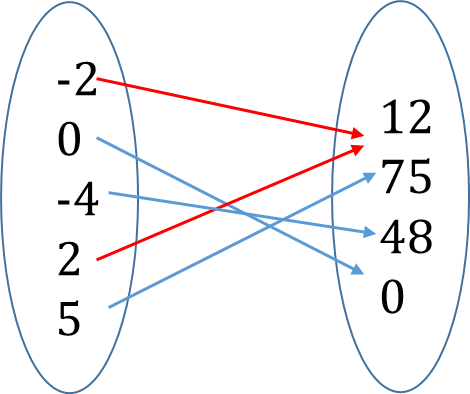
2. Many-to-one: one or more element in the domain have only one output in the co-domain.
E.g. if x is mapped to 3x^2, where x is an integer
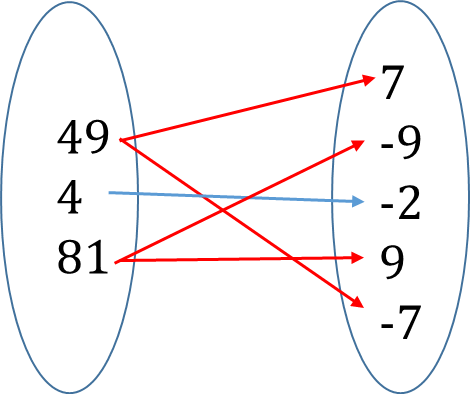
3. One-to-many: One element in the domain can have one or more images in the co-domain.
For example, if x is mapped to √x (x→√x)
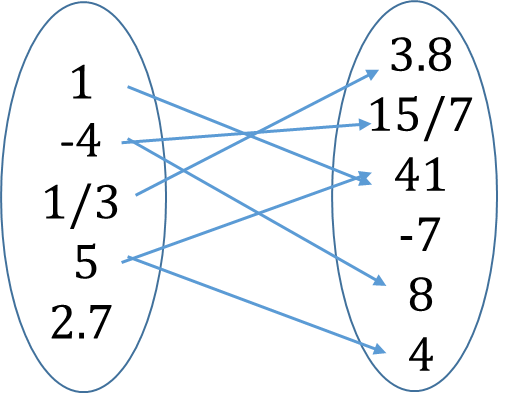
4. Many-to-many: many elements in the domain have many elements in the co-domain
Functions
A function is a type of relation in which each of the element in the domain has one and only one image in the co-domain. With this definition, it means that one-to-one and many-to-one relations are functions.
A function may be defined as a set of rules that relates two or more variables. A function relates an input to an output.
‘Multiply by 2’ is a simple function
| Input | Relationship | Output |
| 1 | ×2 | 2 |
| 3 | ×2 | 6 |
| 46 | ×2 | 92 |
Example: Which of the following are functions? x is the input and y is the output
1. y = 2x – 3
2. x2 + y2 = 4
3. y = 6 – x – x2
Relation 1 is a function. Any value of x produces only one value of y. It’s one-to-one
Relation 2 is not a function. One value of x (such as x = 0) produces two values of y (y = 2 and -2). It’s a one-to-many
Relation 3 is a function. One or more values of x is mapped to only one value of y. Many-to-one.
The most common name of a function is simply ‘f’. The function below can be read as ‘f of x is equal to 2x;

A relation or function can be described in number of ways
a) An arrow diagram
b) A set of ordered pairs
c) An equation
d) A table
e) A Cartesian graph
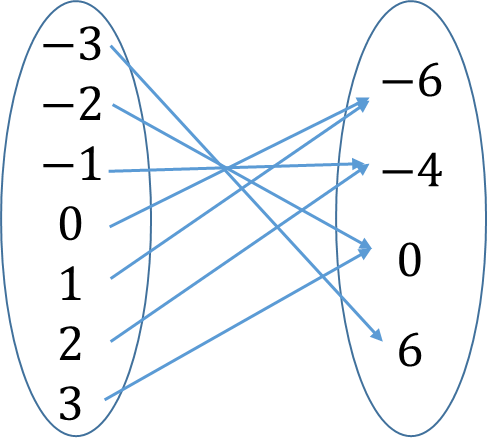
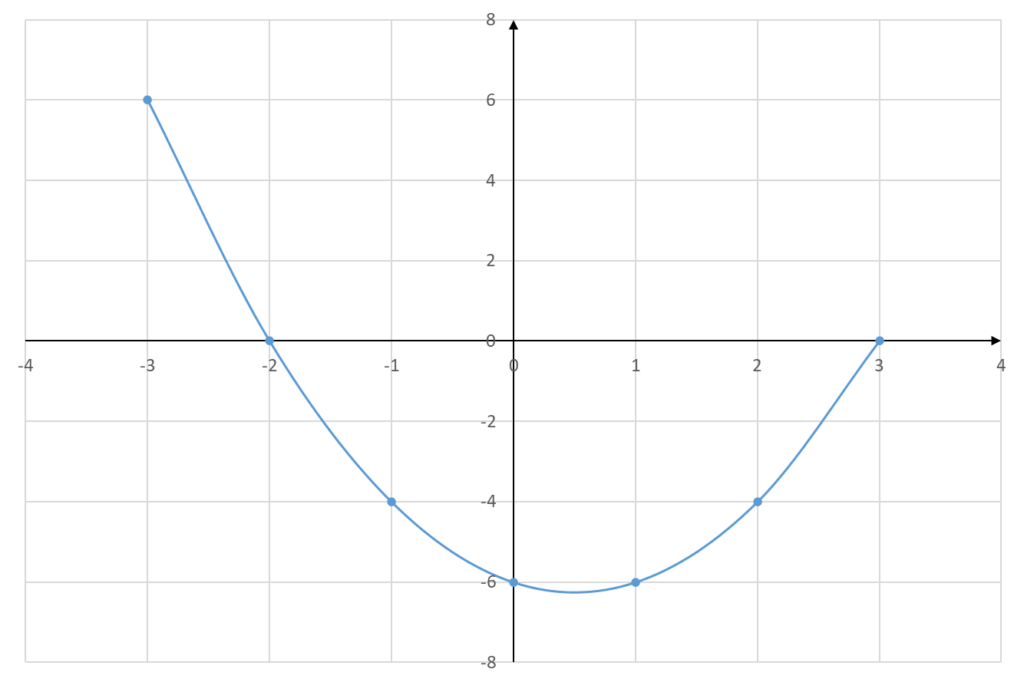
Example: Describe the relation y = x2 – x – 6 for {x:-3 ≤ x ≤ 3} by means of
a) an arrow diagram (b) a set of ordered pairs (c) a table (d) a Cartesian graph
y = x2 – x – 6
When x = -3, y = (-3)2 – (-3) – 6 = 9 + 3 – 6 = 6
when x = -2, y = 4 – 2 – 6 = 0
when x = -1, y = 1 + 1 – 6 = -4
when x = 0, y = -6
when x = 1, y = -6
when x = 2, y = -4
when x = -3, y = 0
a) Arrow diagram
b) Ordered pairs
(-3, 6), (-2, 0), (-1, -4), (0, -6), (1, -6), (2, -4), (3, 0)
c) A table
| x | -3 | -2 | -1 | 0 | 1 | 2 | 3 |
| y | 6 | 0 | -4 | -6 | -6 | -4 | 0 |
d) A Cartesian graph
Example: What are the ranges for the function
f(x) = x2 – 2x for x ∈ {-2, 0, 1, 3, 5}
f(x) = x2 – 2x
when x = -2, f(-2) = (-2)2 – 2(-2) = 8
when x = 0, f(0) = 02 – 2(0) = 0
f(1) = 12 – 2(1) = -1
f(3) = 32 – 2(3) = 3
f(5) = 52 – 2(5) = 15
range = {-1, 0, 3, 8, 15}
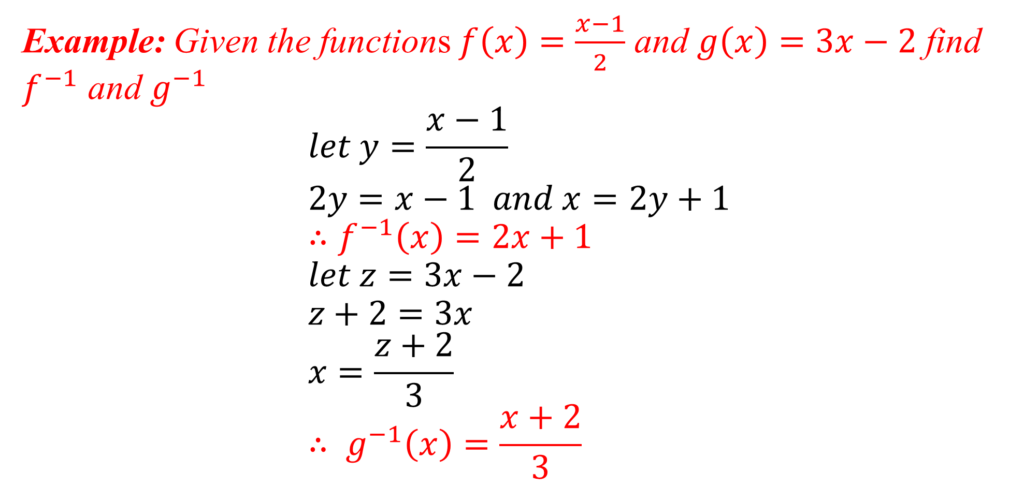
Example: Given that f(x) = 2x + 1 and g(x) = x – 3, find the value of
a) f(2) (b) g(-1) (c) f(x2) (d) g(x2 – 1)
f(x) = 2x + 1
a) f(2) = 2(2) + 1 = 5
b) Since g(x) = x – 3, then g(-1) = -1 – 3 = -4
c) f(x2) = 2(x2) + 1 = 2x2 + 1
d) g(x2 – 1) = (x2 – 1) – 3 = x2 – 4
Composite Function
The function composition of two functions takes the output of one function and uses it as an input of the other function.
Given two functions f(x) and g(x), then g o f = g(f(x))
Example: Given that f(x) = 2x – 3 and g(x) = x2 – 1
Find a) f o g b) g o f
a) f o g = f(g(x)) = f(x2 – 1) = 2(x2 – 1) – 3
= 2x2 – 2 – 3
= 2x2 – 5
b) g o f = g(f(x)) = g(2x-3) = (2x – 3)2 – 1
= 4x2 – 12x + 9 – 1
= 4x2 – 12x + 8
Notice that f o g ≠ g o f
Inverse Function
An inverse function f-1 can simply be described as a function in the opposite direction, that is, from y to x.
Formula
A formula is a special type of equation that expresses a relationship between two or more quantities or variables.
e.g. A = πr^2
This is a formula that shows the relationship between the area of a circle A and its radius r
π is a constant and has an approximate value of 3.14 or 22/7
A is the dependent quantity and r is the independent quantity. A is referred to as the subject of the formula.
Substitution and evaluation of a formula
The formula for the period T of a simple pendulum is given by T = 2π√(l/g)
where l is the length in metres, g is the gravitational constant = 9.8m/s2 and π = 3.14
We can find the numerical value of the dependent variable T when giving a value for the independent variable l (and vice versa).
For example, if we wish to find T when l = 0.28m
T = 2π√(l/g)
= 2 × 3.14 × √(0.28/9.8)
T = 1.062 sec


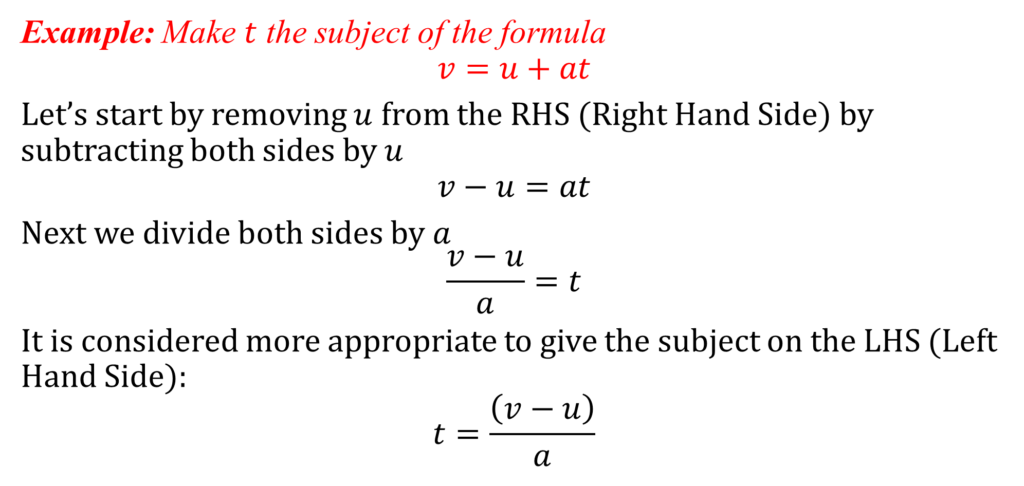
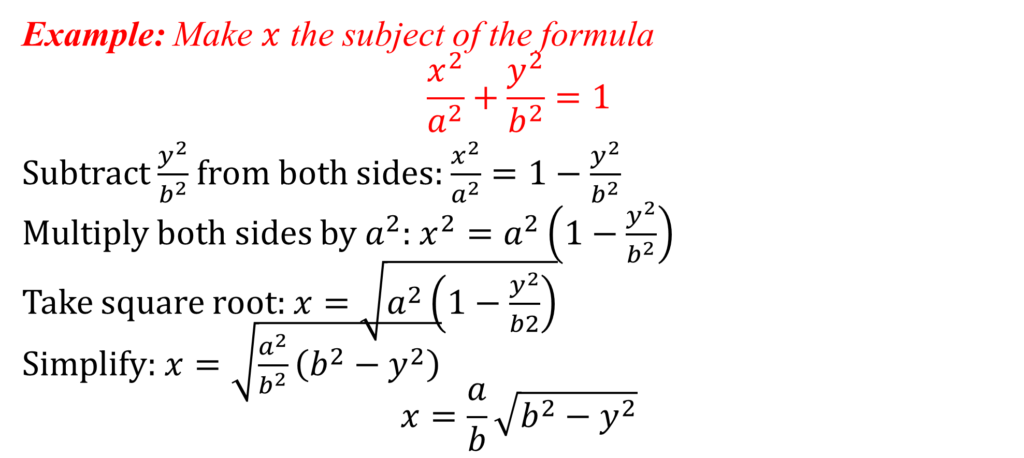
Change of Subject of Formula
You will often be required to change the subject of a formula.
To do this, think of the formula or equation like a balance. If any maths operation is performed on one side, the same must be performed on the other side of the formula.
Alternatively, we can remove the symbol attached to a variable on one side by carrying out the ‘opposite’ operation to that symbol on the other side.
These opposite pairs are usually
• Addition ↔ subtraction
• Multiplication ↔ division
• Powers ↔ roots
There are many different formulae and so there isn’t a single approach of finding the subject of a given variable.
However, remember the following tips
- Locate the variable that you wish to make the subject in its present position(s).
- Begin by clearing fractions, brackets and roots
- Rearrange the formula so that all the terms that contain the subject are on one side, preferable the LHS
- Simplify as far as possible
Practice
Make the letter(s) shown the subject of formula
1. I=PRT/100 , R
2. V=1/3 πr^2 h , r
3. 1/f=1/u+1/v f, u
4. V=1/3 πh(R^2+2Rr+r^2 ) , r
VARIATION
Direct Variation
Imagine you go to the supermarket to buy some tins of milk
Let’s say 1 tin cost $3
2 tins will cost 2 × $3 = $6
5 tins will cost 5 × $3 = $15
n tins will cost n × $3 = $3n
As the number of tins bought increases, the total cost increases. This is direct variation. In direct variation or direct proportion, as one quantity increases (or decreases), the other quantity also increases (or decreases).
In the example given earlier, the total cost, say C, is proportional to the number of tins bought n
C ∝ n
The symbol ∝ meaning “varies with” or “is proportional to” is used to show variation.
You notice that when n was 1, C was 3 and as n was increasing, we kept on multiplying the constant 3 by the new value of n.
3 is therefore called the constant of proportionality.
We can transform the variation into a relationship or an equation, that is
C = 30n
So in general, if y varies directly as x, it is written as y ∝ x and expressed as y = kx where k is the constant of proportionality.
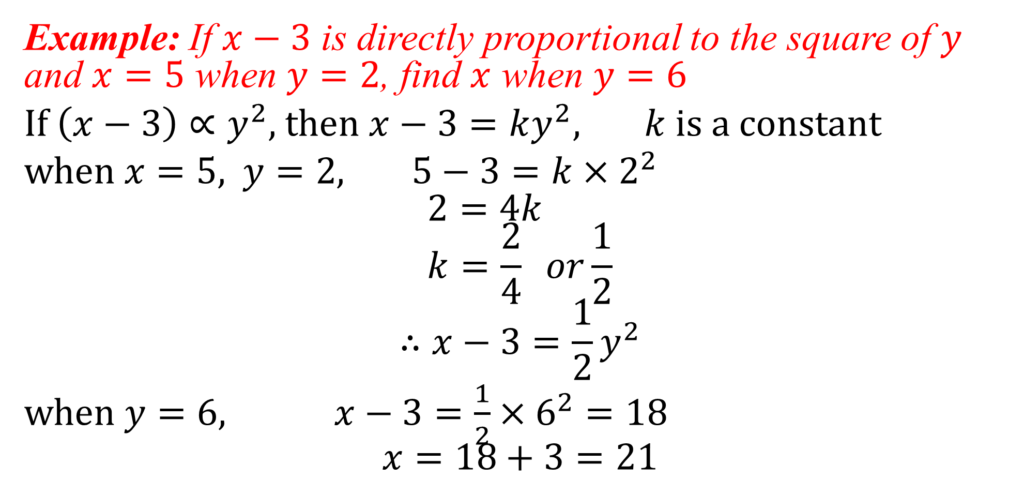
Example: If a ∝ b and a = 20 when b = 6, find a relationship between a and b. Hence find b when a = 50.
a ∝ b, then a = kb (k is a constant)
when a = 20, b = 6 20 = k × 6
k = 20/6 = 10/3
∴ a = 10/3 b
This is the required relationship
when a = 50, 50 = 10/3 b
b = (50 × 3)/10 = 15
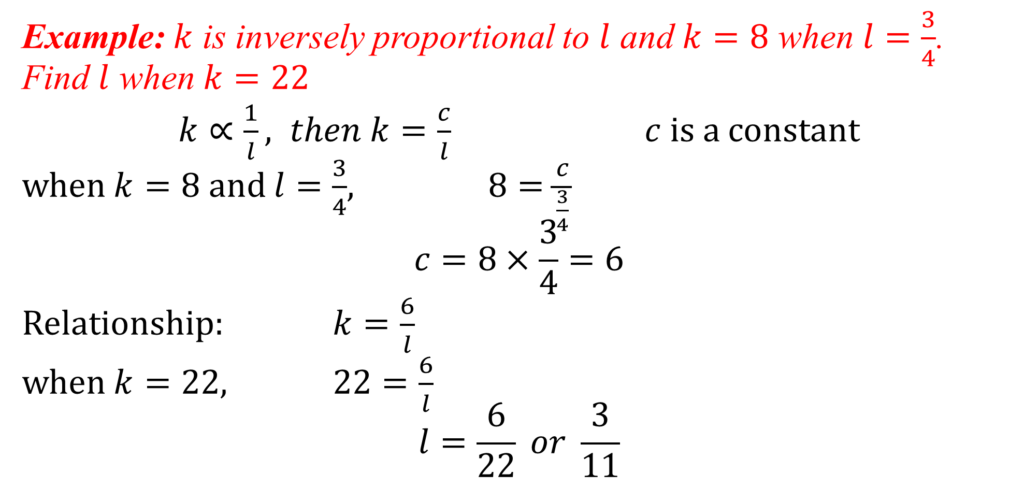
Inverse Variation
If y varies inversely as x, then y ∝ 1/x.
In inverse variation, as one quantity is increasing, the other is reducing. For example, if 3 men set out to do a piece of work and it takes them 6 days to complete the work, then if there were 5 men (more of one quantity), it would take them a lesser number of days to complete the work.
Another example is when a man intends to travel from Lagos to Abuja. The speed at which he travels is inversely proportional to the time it takes.
Using real approximate values, if he travels by road at an average speed of 100 km/hr, it will take him about 9 hours.
If he travels by air at an average speed of 950 km/hr, it will take about 55 minutes (less than 1 hour). As the speed increases, the journey time reduces
Joint Variation
Joint variation involves more than two variables
For example, the mass m of a sheet of metal is proportional to both the area A and the thickness t of the metal.
Hence m ∝ At
Example: The mass of a solid metal ball varies jointly as its relative density and the cube of its radius. When the radius is 7cm and relative density 7.5, the mass is 840g. Find the mass of a ball of relative density 10.5 and radius 8cm.
Let m – mass, d – relative density, r – radius
m ∝ dr3
m = kdr3 where k is a constant
840 = k × 7.5 × 73
k = 840/(7.5)(73) = 0.3265
Thus when relative density and radius is 10.5 and 8cm respectively, mass m is
m = 0.3265 × 10.5 × 83
m = 1755.3g

Partial Variation
This type of variation consists of two or more parts added together.
For example, the cost of building a house depends on two major things: the cost of materials and the time it takes to build the house.
The cost of materials such as cement, block and wood is constant but the time it takes to build the house varies. A house with designs will take a longer time to finish than a simple building.
So, we can say that the cost of building B, is partly constant and partly varies with the time taken t.
Mathematically, B = k + ct where k and c are constants
Example: G is partly constant and partly varies with V. When V = 20, G = 75 and when V = 59, G = 192.
a) Find a formula connecting G and V
b) Hence find G when V = 73
G = c + kV where c and k are constants
75 = c + 20k…(i)
192 = c + 59k…(ii)
eqn. (ii) – (i): 117 = 39k
k = 3
put k = 3 in eqn. (i): 75 = c + 20(3)
c = 75 – 60 = 15
a) Formula: G = 15 + 3V
b) when V = 73, G = 15 + 3(73) = 15 + 219
G = 234
POLYNOMIALS
In a polynomial, the highest power of the variable is 2 or more.
For example, f(x) = 4x3 – 3x2 + 2x – 1 is a polynomial of the third degree
Notice in the polynomial,
• The terms are usually written in decreasing powers of x
• 4, -3 and 2 are the coefficients x3, x2 and x respectively
Given the polynomial f(x) = 4x3 – 3x2 + 2x – 1. Find
a) f(1) b) f(-2) c) f(1/2) – f(1/3)
a) f(1) simply means substitute x = 1 into the function
f(1) = 4(1)3 – 3(1)2 + 2(1) – 1
= 4 – 3 + 2 – 1
f(1) = 2
b) f(-2) = 4(-2)3 – 3(-2)2 + 2(-2) – 1
=4(-8) – 3(4) – 4 – 1
f(-2) = -32 – 12 – 4 – 1
f(-2) = -49

Addition and Subtraction of Polynomials
Consider two polynomials
F1 = 2x3 – 5x2 + x – 7 and F2 = x3 + 2x – 5
find a) F1 + F2 (b) F1 – F2 (c) 3F2 – 2F1
a) F1 + F2 = 2x3 – 5x2 + x – 7 + x3 + 2x – 5
Collect like terms: F1 + F2 = 3x3 – 5x2 + 3x – 12
b) F1 – F2 = 2x3 – 5x2 + x – 7 – (x3 + 2x – 5)
open brackets and collect like terms:
= 2x3 – x3 – 5x2 + x – 2x – 7 + 5
= x3 – 5x2 – x-2
c) 3F2 – 2F1 = 3(x3 + 2x – 5) – 2(2x3 – 5x2 + x – 7)
= 3x3 + 6x – 15 – 4x3 + 10x2 – 2x + 14
= -x3 + 10x2 + 4x – 1
We can also carry out the addition and subtraction like this
F1 : 2x3 – 5x2 + x – 7
F2 : x3 + 2x – 5
F1 + F2: 3x3 – 5x2 + 3x – 12
Multiplication of Polynomials
(3x – 2)(x + 4)
3x2 + 12x – 2x – 8
3x2 + 10x – 8
A similar method is used to multiply higher degree terms
Example: Multiply x2 + x – 2 by 2x + 3
(x2 + x – 2)(2x + 3)
Each term in one bracket is used to multiply all the terms in the other bracket(s) and the results are collected together
2x3 + 3x2 + 2x2 + 3x – 4x – 6
2x3 + 5x2 – x – 6
SEQUENCES & SERIES
INTRODUCTION
Look at these sets of numbers. Can you predict the next three terms?
1, 3, 5, 7, __
2, 6, 18, 54, __
0, 1, 1, 2, 3, 5, 8, __
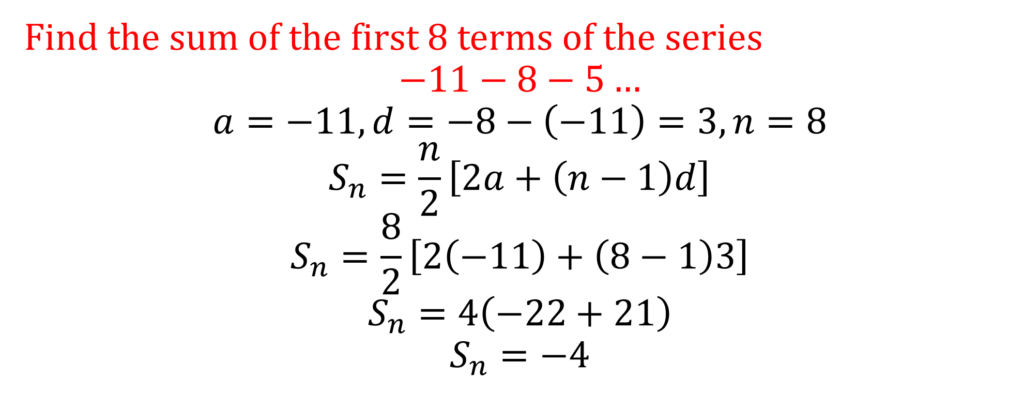
ARITHMETIC PROGRESSION
Given the sequences shown below
2, 4, 6, 8, 10, 12, 14,…
-5, -8, -11, -14, -17, -20,…
Do you notice that we add 2 and subtract 3 respectively to get the next term?
Whenever you add or subtract a constant number to get the next term in a sequence, it’s called a linear sequence or arithmetic progression (AP for short).
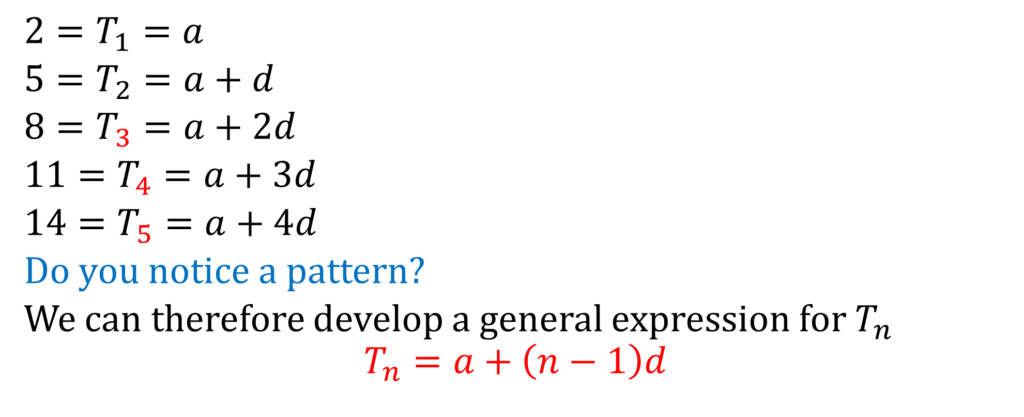
Let’s examine a simple sequence:
2, 5, 8, 11, 14, 15
The first term is represented by a ( = 2)
The number of terms in the sequence is represented by n ( = 6)
The nth term is represented by Tn
The common difference between two consecutive terms is represented by d and is gotten by subtracting a term from its next term, that is, d = T2 – T1 = 3
The nth term of an AP

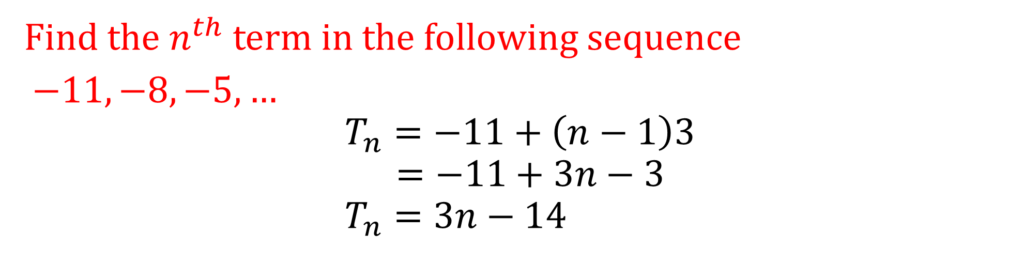
WORKED EXAMPLES


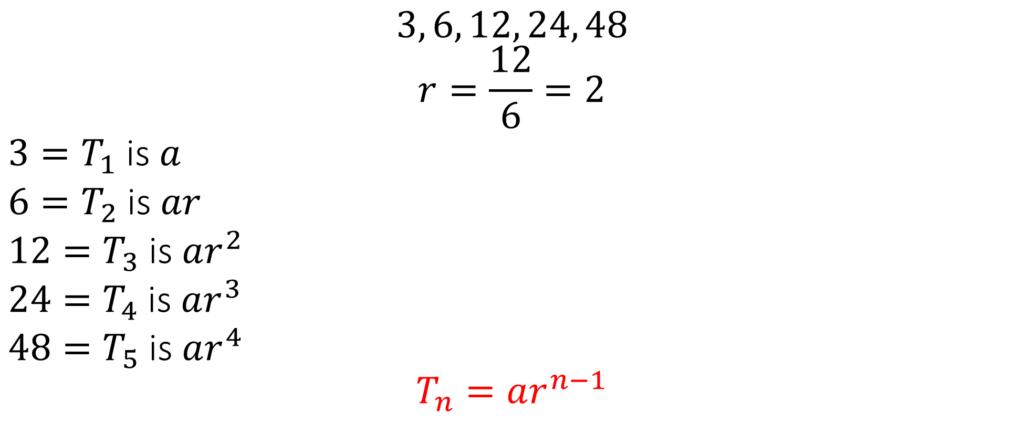
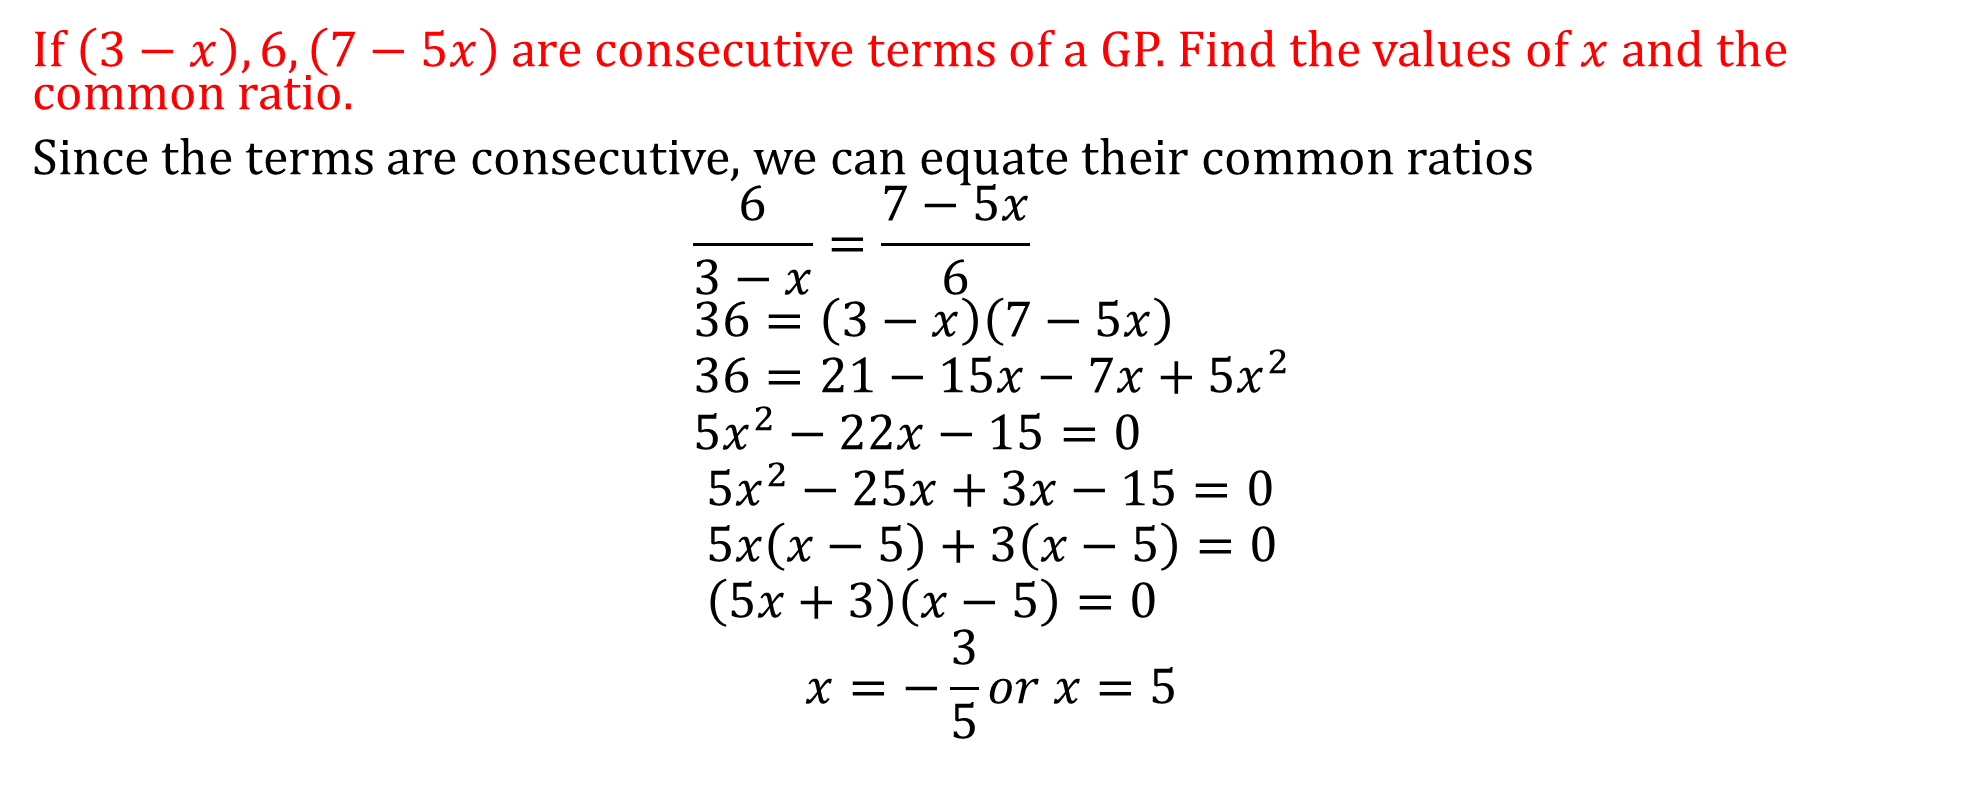
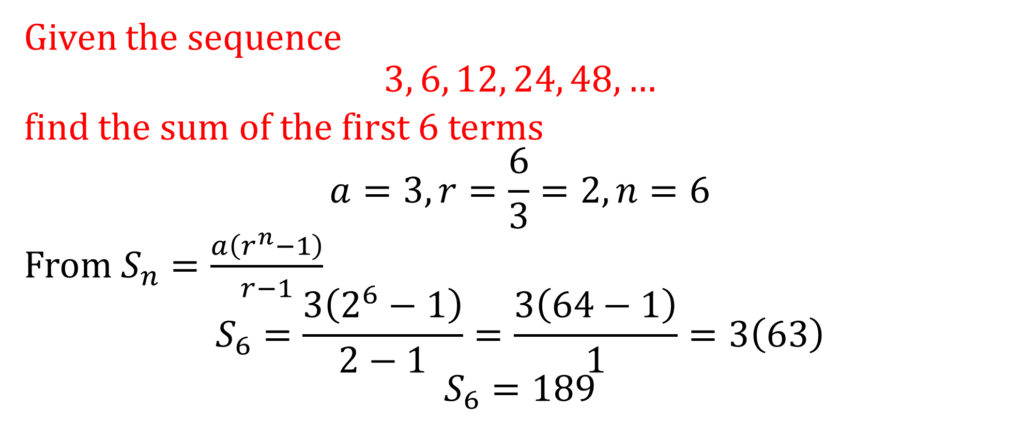
GEOMETRIC PROGRESSION
Consider the following sequence
3, 6, 12, 24, 48
The next term is gotten by multiplying 3.
Whenever you multiply or divide a constant number to get the next term in a sequence,
it is called an exponential sequence or geometric progression, GP for short. This constant number is the common ratio given as

nth Term of a GP
WORKED EXAMPLES

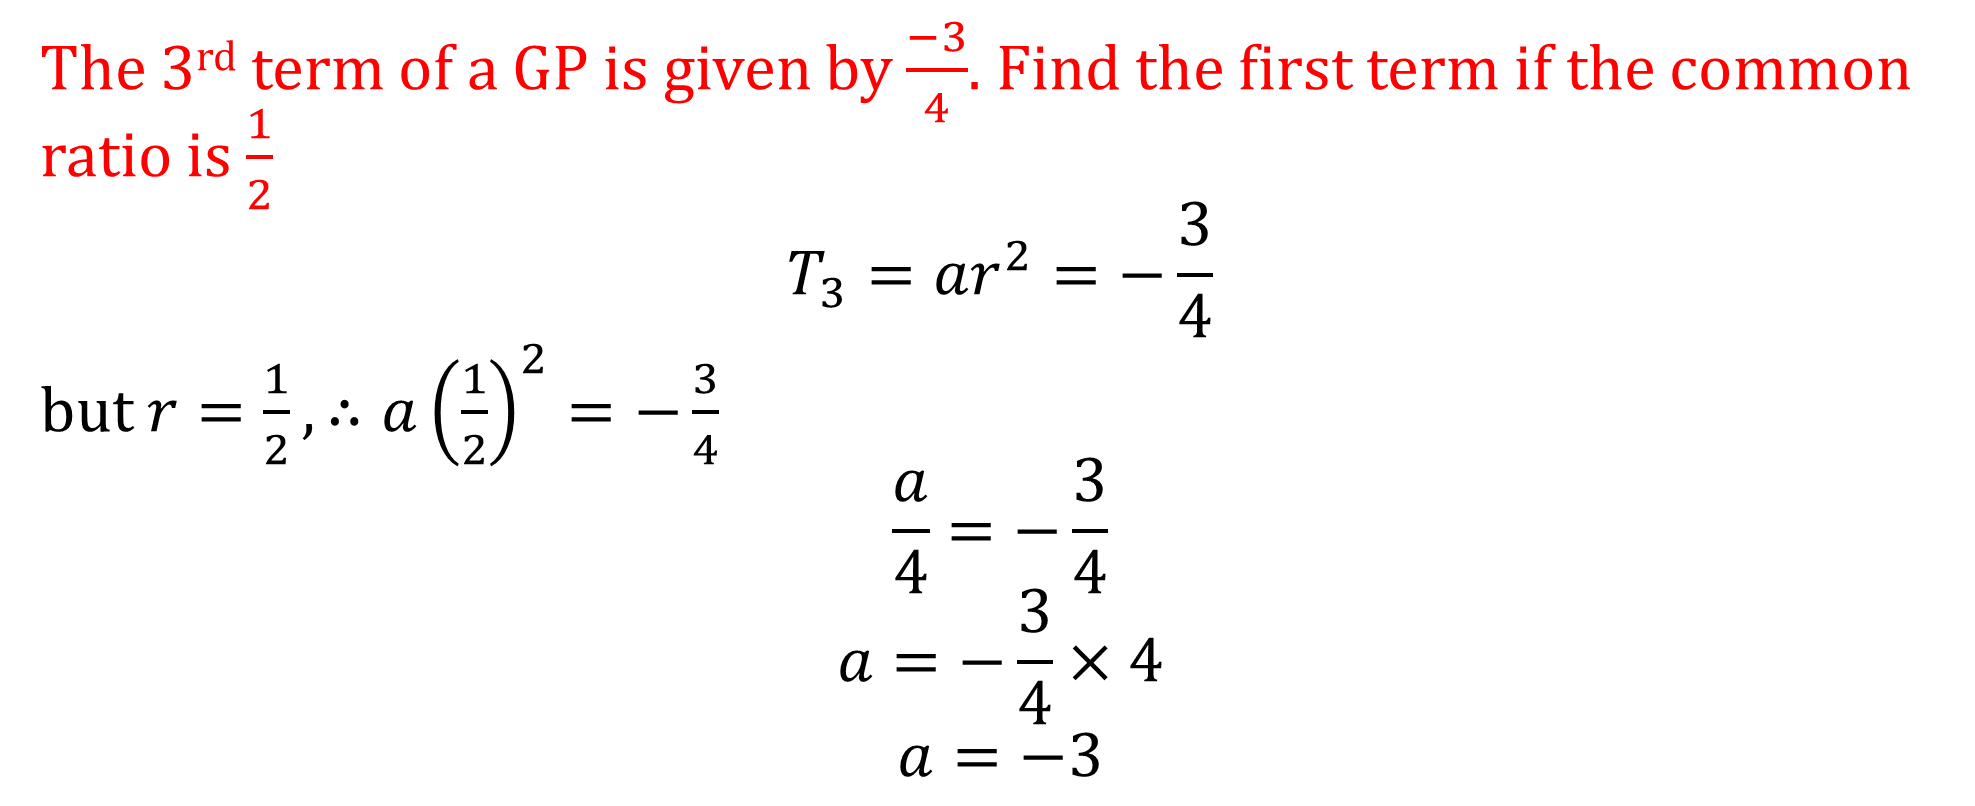


Example
Sum of a GP

Example
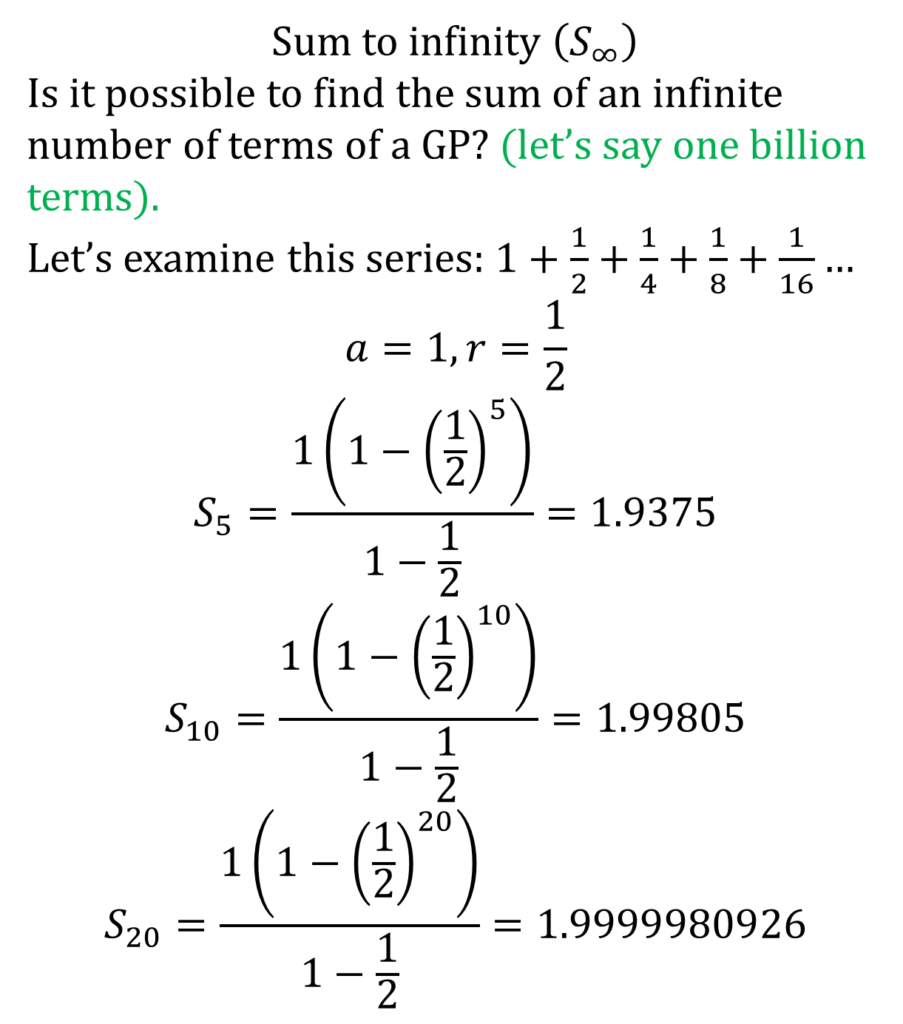
Okay, let’s stop here. What do you notice about the sum?
Do you observe it approaches a certain number?
The sum gets closer and closer to 2 but never actually gets there no matter how many terms we add. In mathematics, we can conclude that the sum to infinity of the given series is 2.
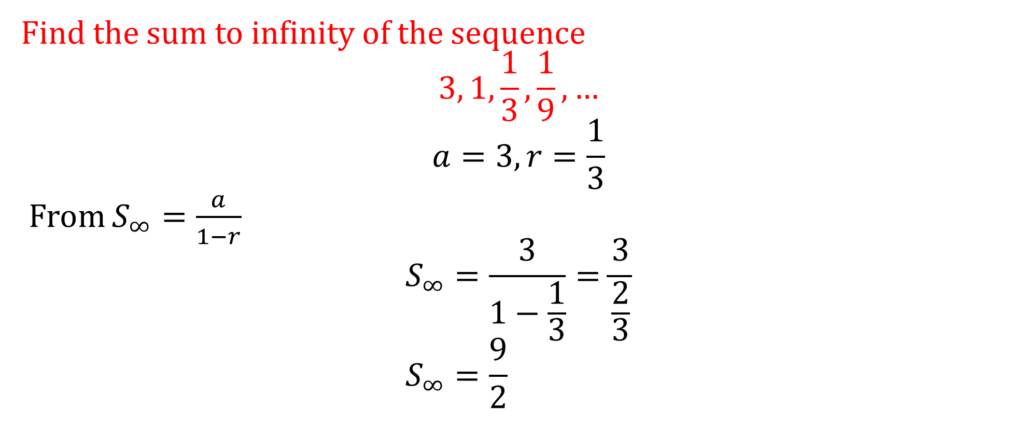
And generally, we define sum to infinity of a GP as
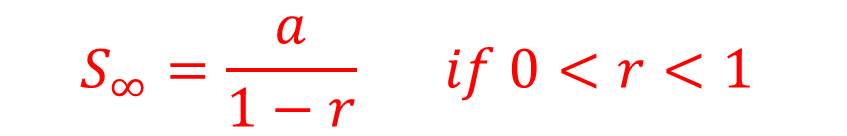
Worked Example
OTHER SEQUENCES
Find the 8th term of each of the sequences
a) 1, 4, 9, 16, 25,…
b) 1, 1, 2, 3, 5, 8, …
Solution
a) This is a sequence formed from the squares of the integers beginning from 1
1(12), 4(22), 9(32), 16(42), 25(52), …
Therefore T8 = 82 = 64
b) This is an interesting sequence called Fibonacci sequence. The next number is found by adding the two numbers before it
Thus, T8 = 21
Ask Google about Fibonacci sequence and discover some interesting mysteries about this special sequence
EXERCISES
1. The fifth term of an Arithmetic Progression (A. P.) is 11 and the eighth term is 20. Find the:
a) 12th term.
b) Sum of the first 12 terms.
2. The third and sixth terms of a Geometric Progression (G.P.) are ¼ and ¹⁄₃₂ respectively. Find the:
a) First term and the common ratio
b) Seventh term.
3. The second, fourth and sixth terms of an Arithmetic Progression (A.P.) are x − 1, x + 1 and 7
respectively. Find the:
a) Common difference;
b) First term;
c) Value of x.
4. The sum of the first ten terms of an Arithmetic Progression (A.P.) is 130. If the fifth term is 3 times the first term, find the:
a) Common difference
b) First term
c) Number of terms of the A.P. if the last term is 28.
5. If the sixth term of an Arithmetic Progression (A.P.) is 37 and the sum of the first six terms is 147, find the:
a) First term
b) Sum of the first fifteen terms.
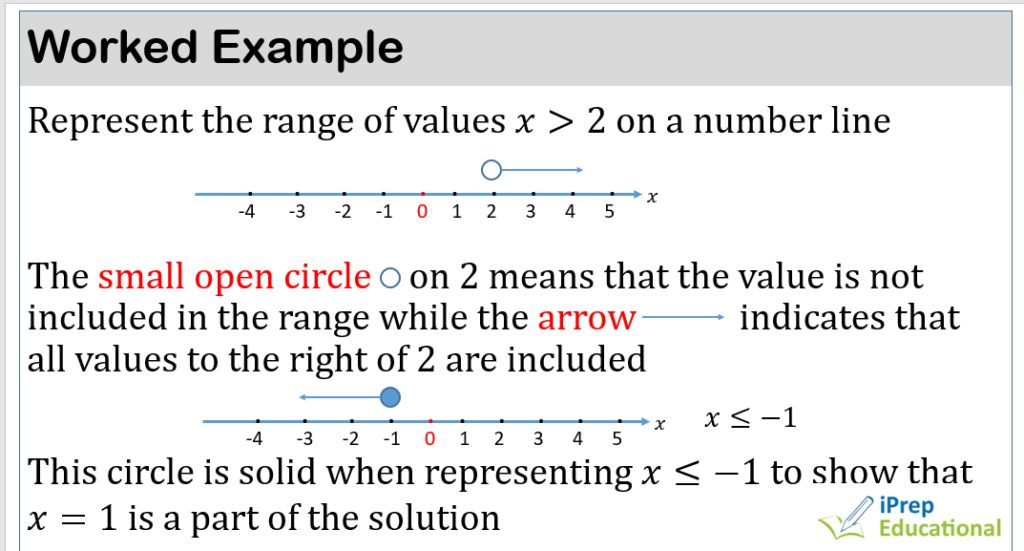
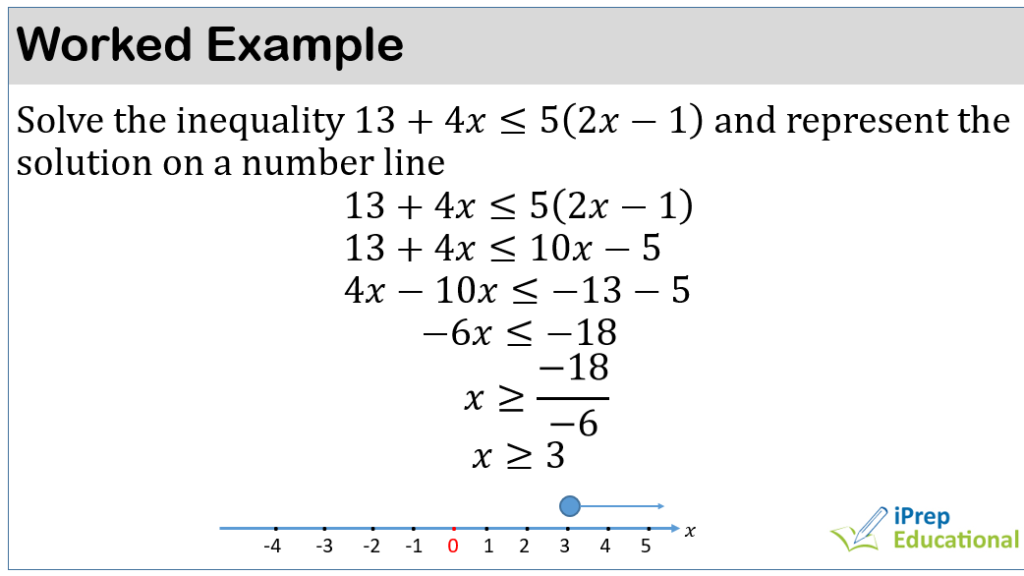
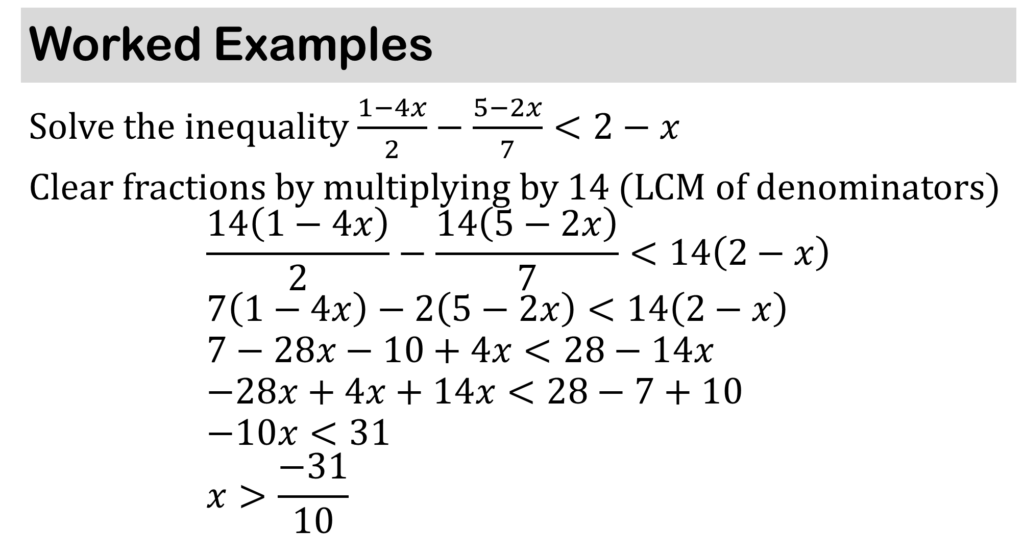
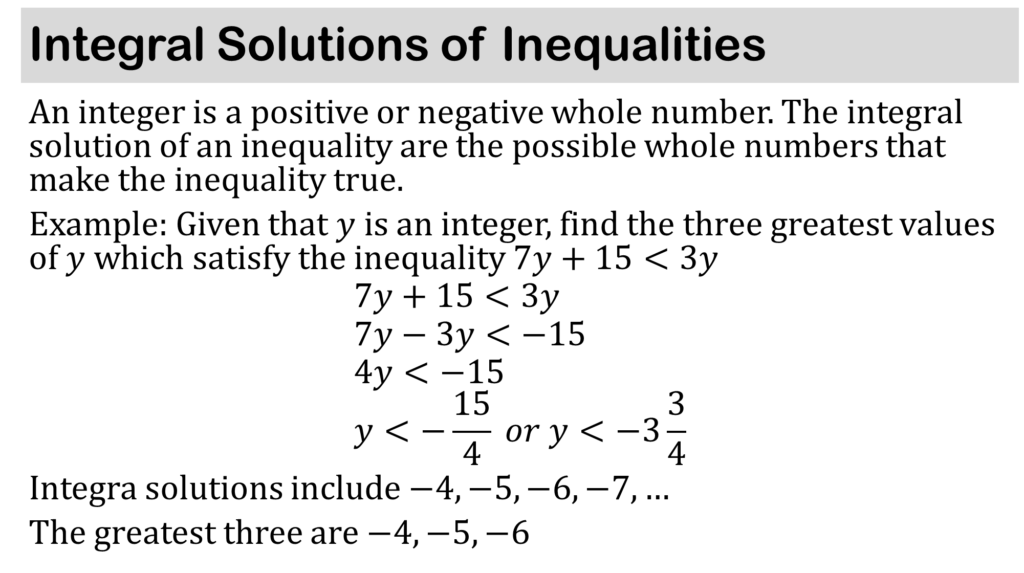
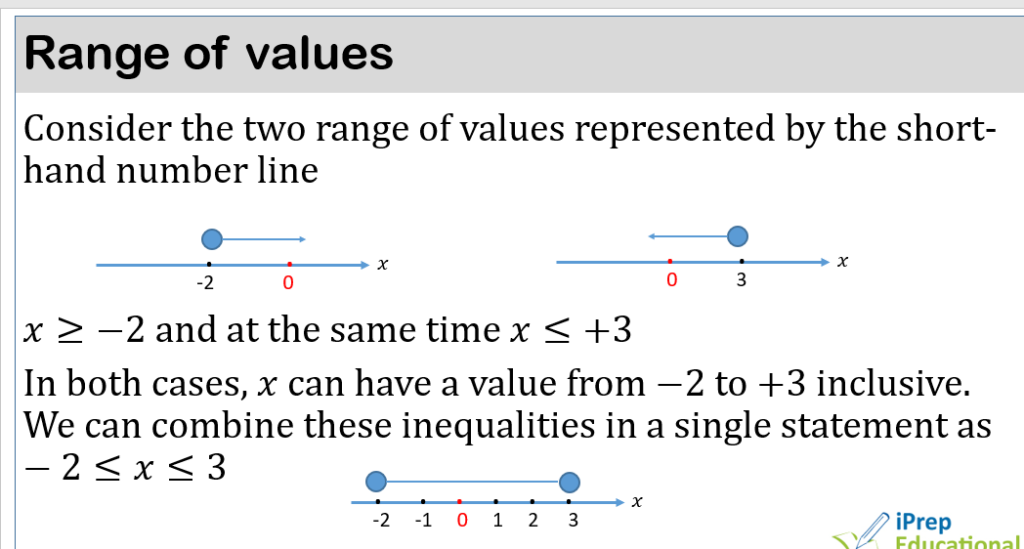
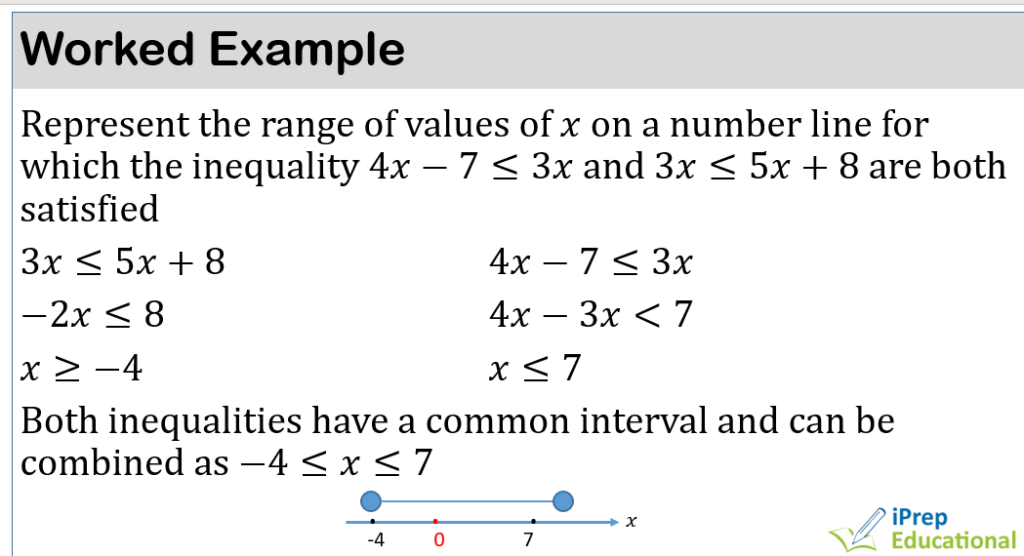
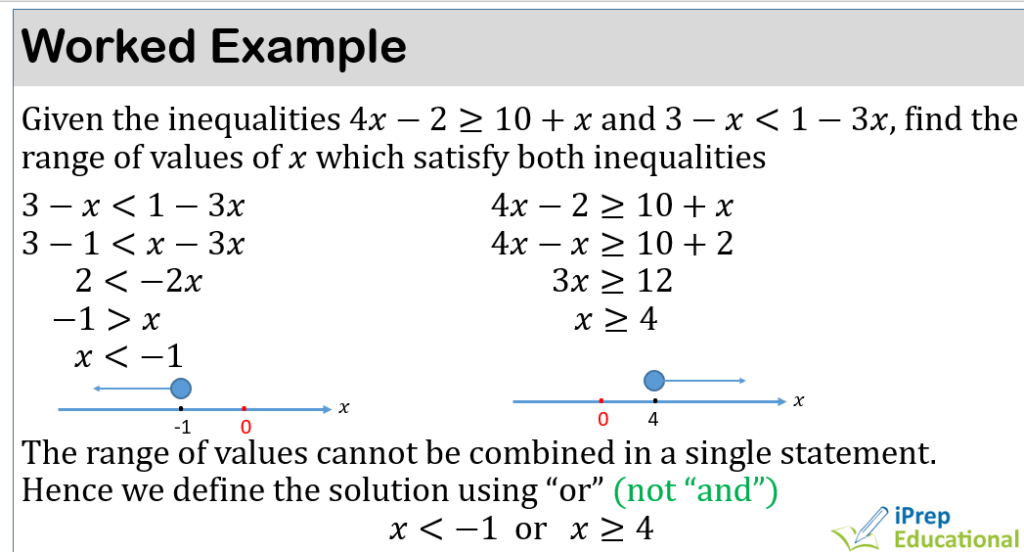
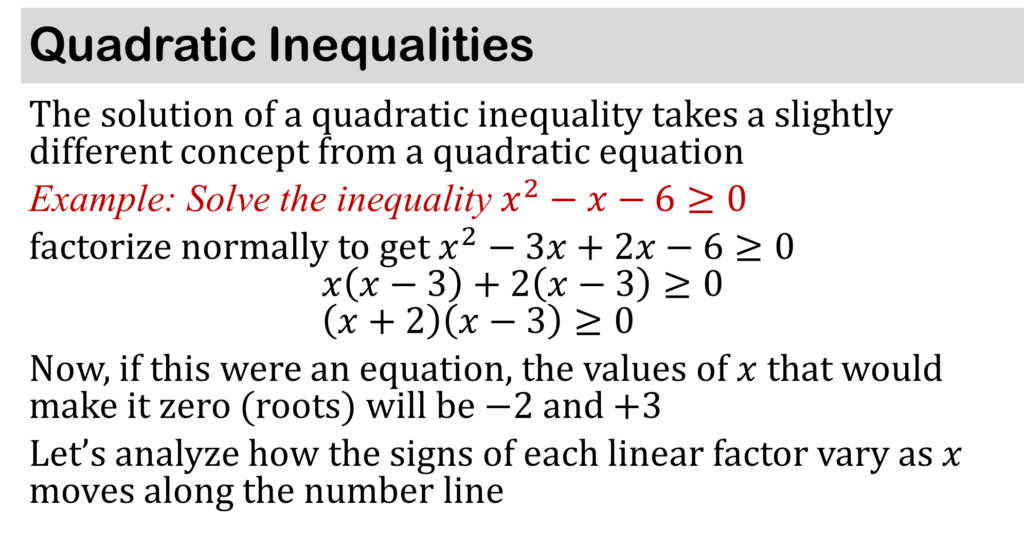
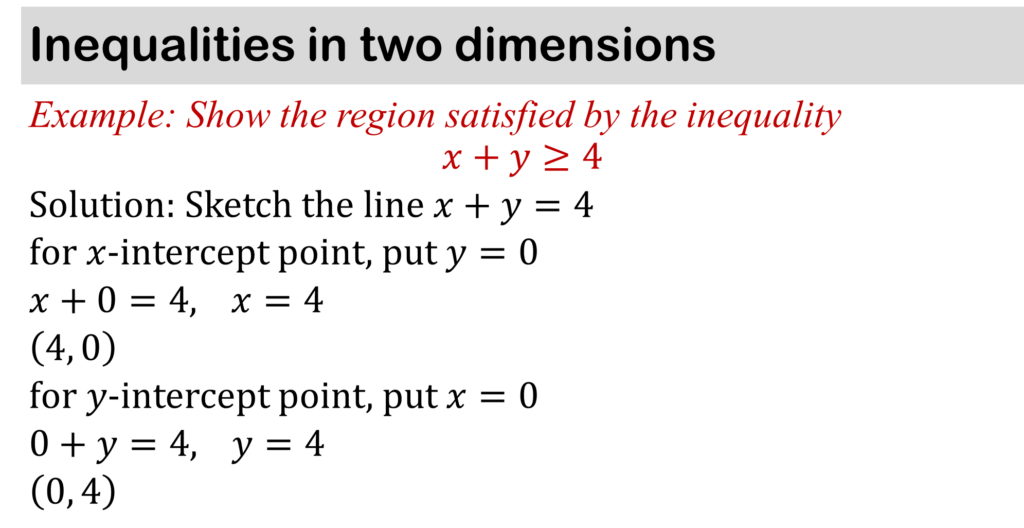
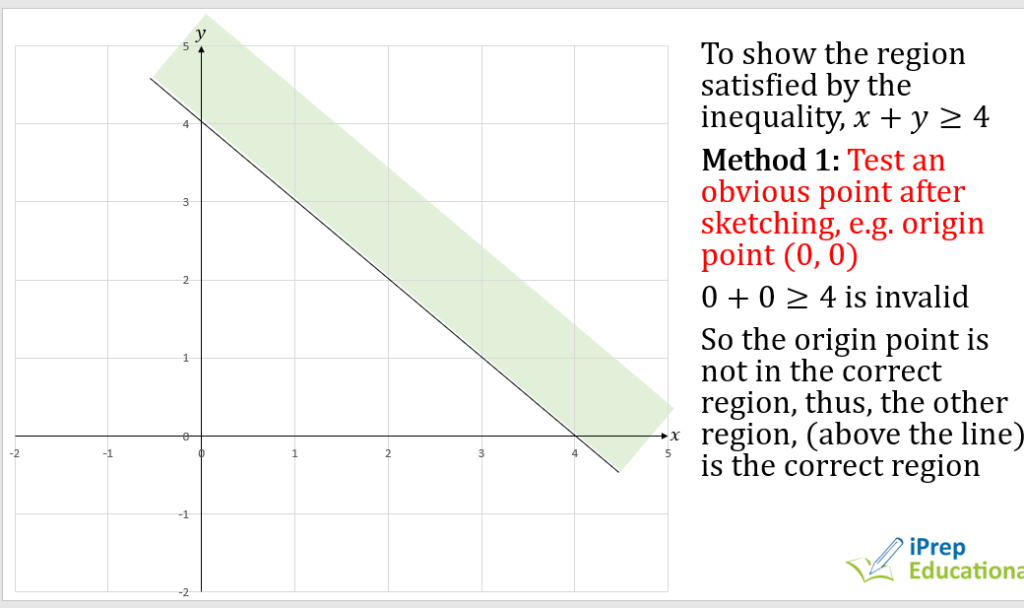
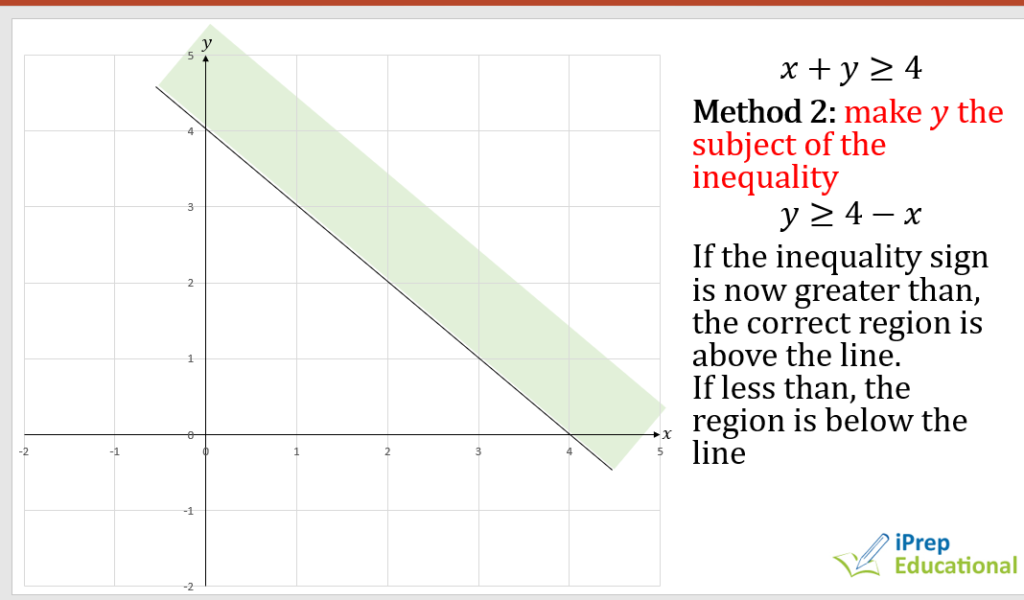
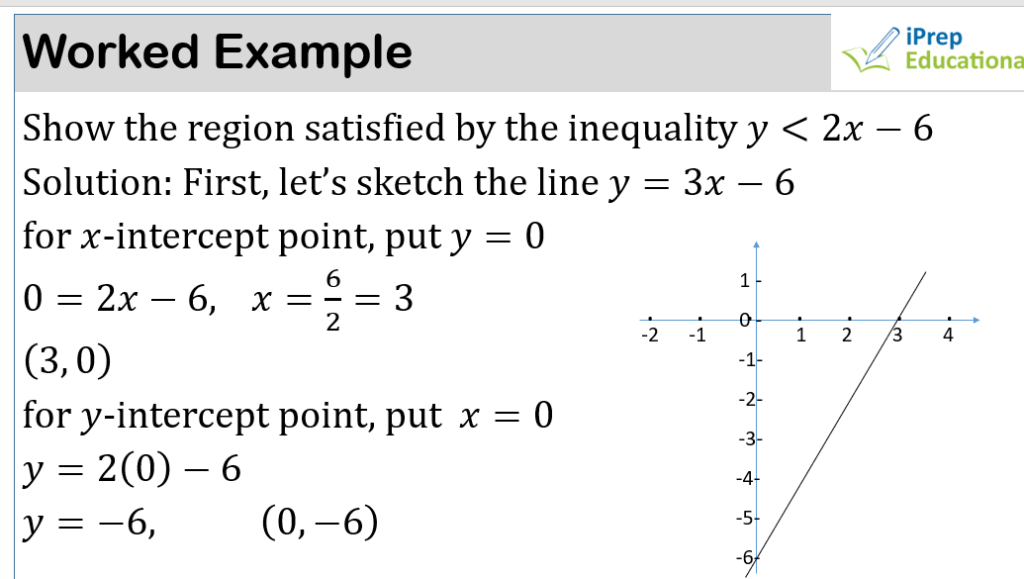
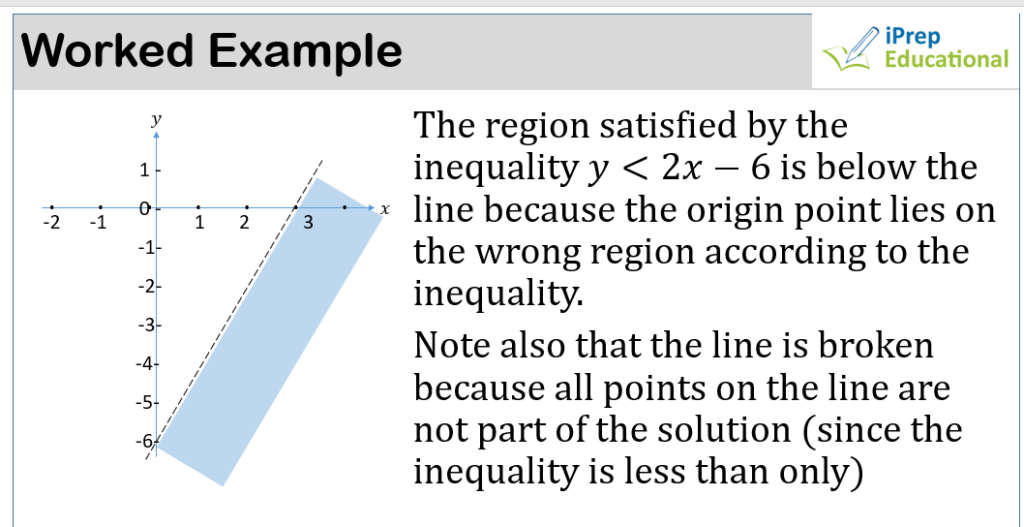
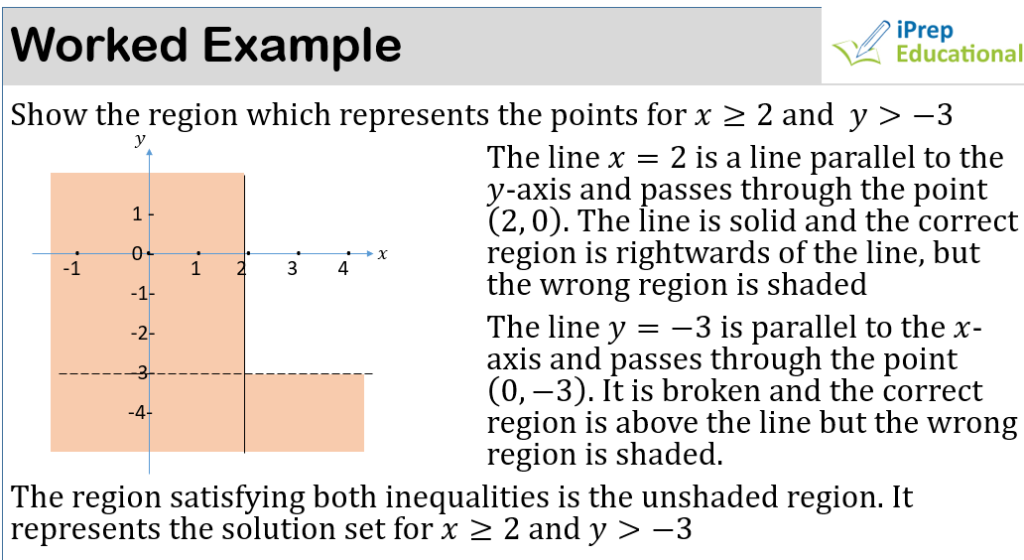
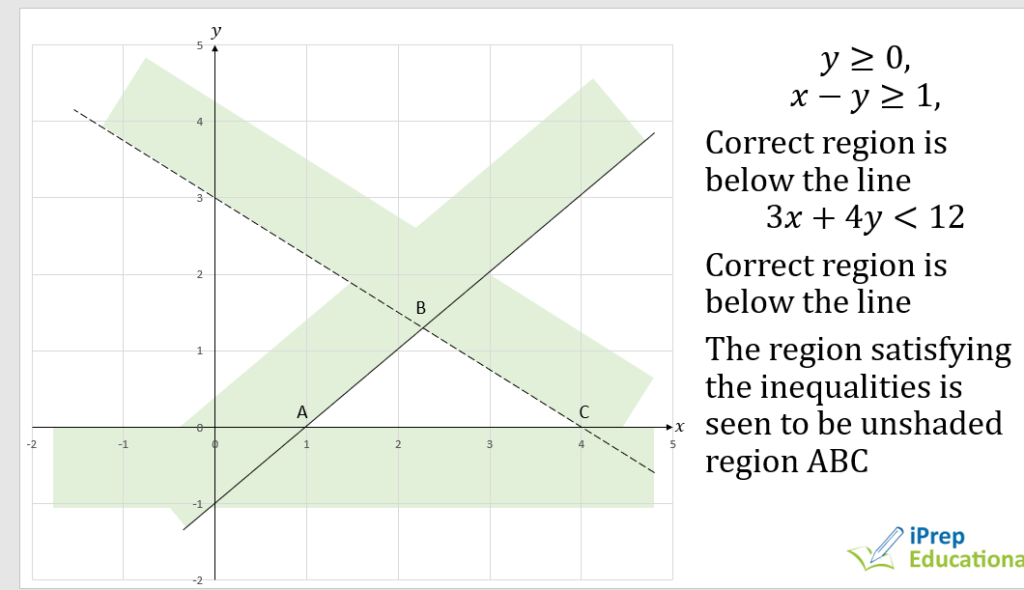
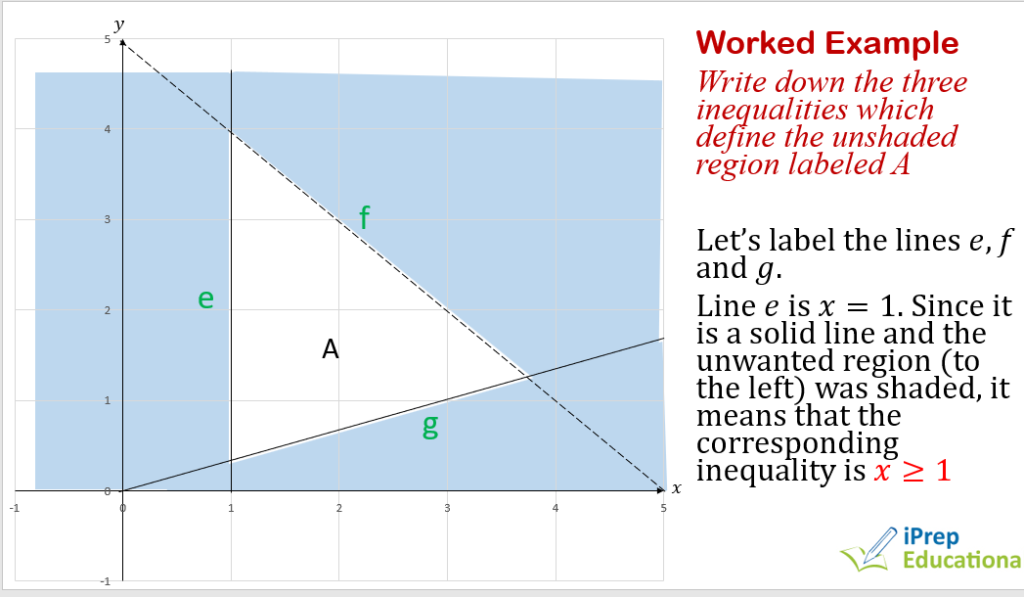
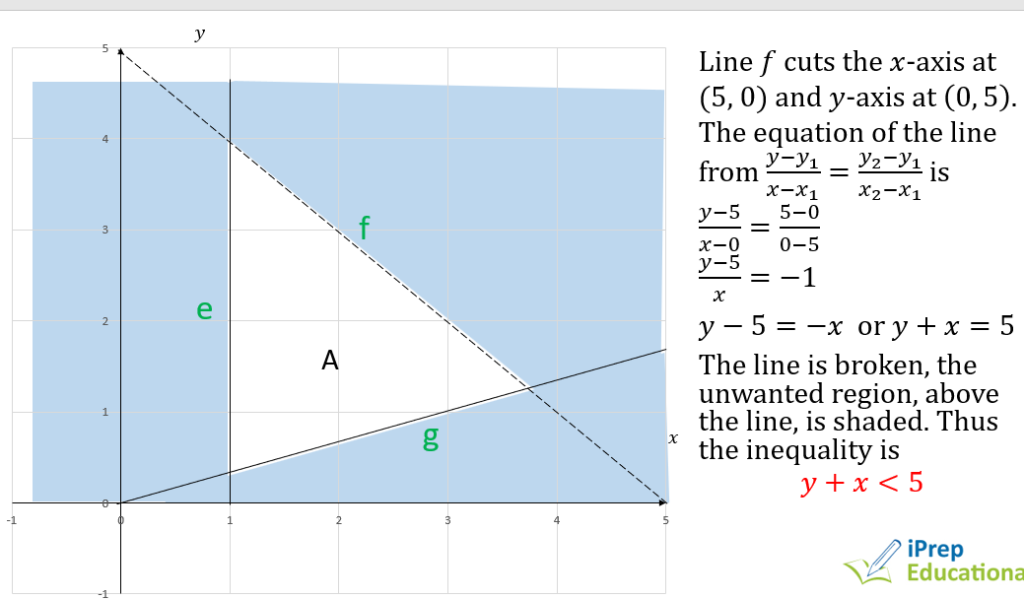
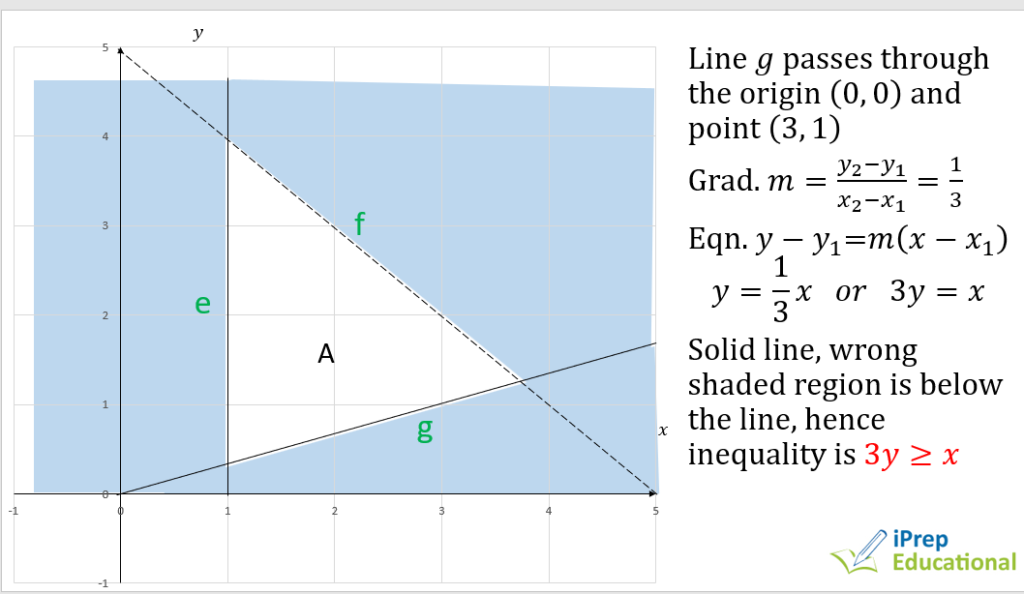
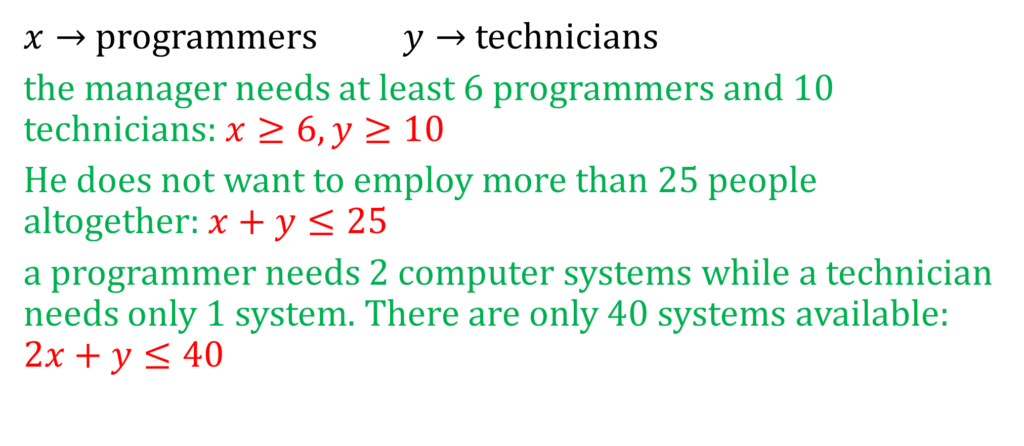
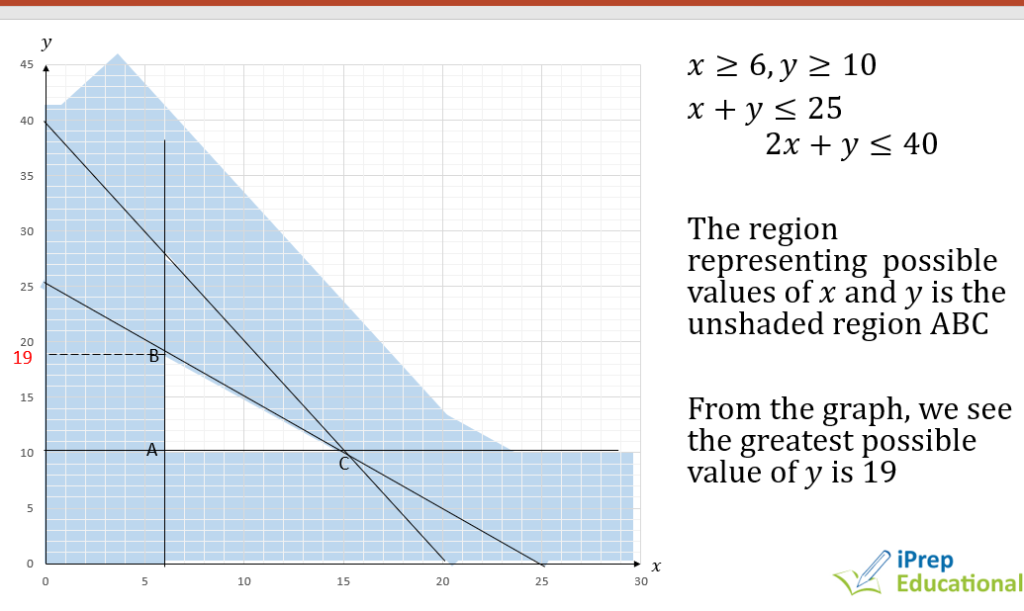
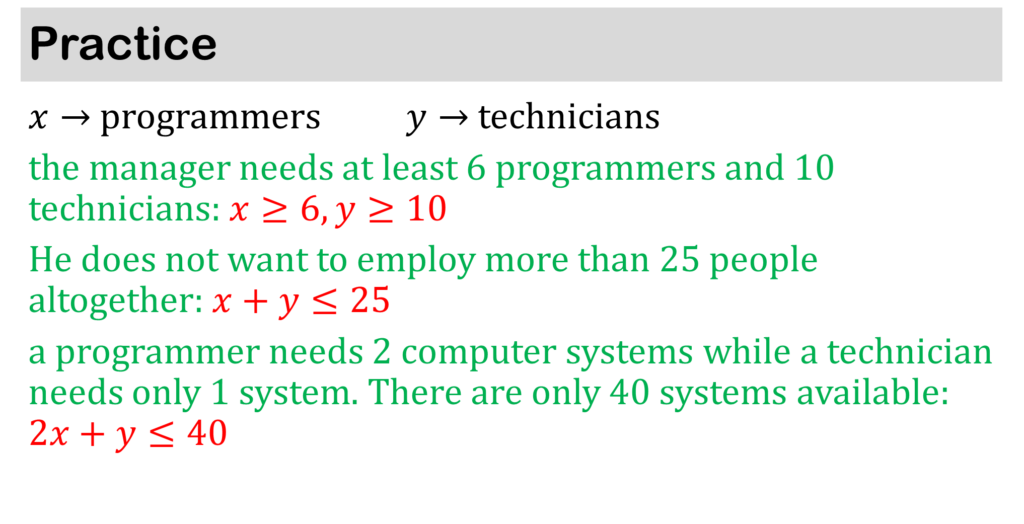
INEQUALITIES


SETS & BINARY OPERATIONS
Introduction
A set is a collection of objects or things
For example, a set of numbers from 1 to 10, a set of members of a family.
A set is usually represented by curly brackets { }, and a capital letter is used to name the set
P = {Prime numbers from 1 to 20}
Elements of a set
The elements of a set are the things or objects that belong to that set.
For example, in the set P = {Prime numbers from 1 to 20}, the elements are P = {2, 3, 5, 7, 11, 13, 17, 19}
We use the symbol ∈ meaning “is an element of” or “belongs to” and ∈ means “is not an element of” or “does not belong to”. Thus,
3 ∈ P
4 ∈ P
number of elements of a set
n(P) is a short way of writing number of elements in set P.
P = {2, 3, 5, 7, 11, 13, 17, 19}
n(P) = 8
NOTE that we count only non-repeated items of the set
Subset
A subset is a set that is within another set. We use the symbol ⊂ to represent subset and ⊄, which means “not a subset of”
Consider a bowl containing a set of fruits like mangoes, oranges, pawpaw and bananas.
If we pick another set of mango, pawpaw and banana, then we have a subset of the set of fruits in the bowl.
Consider 2 sets
A={a, b, c, d, e, f} and B={c, d, e, f}
B is a said to be a subset of A, that is, B⊂A
Types of Sets
Empty Set
A set is said to be empty when there are no elements or members of that set.
e.g. {a human being with 3 heads}, {a square with heads}, etc
An empty set is also called a null set and we use the symbol ϕ to represent an empty set
NOTE that {0} is not an empty set because it contains the element 0
Finite set
The elements in a finite set can be counted. E.g. {countries in Africa}
Infinite set
The elements in this set cannot be counted. E.g. {even numbers}, {grains of sand on the beach}
Disjoint set
Two sets are said to be disjoint if they have no elements in common
e.g. X={3, 6, 9, 12}, Y={a, b, c, d}
X and Y are disjoint
Equal sets
Two sets are said to be equal if they contain the same members or elements
e.g. R={first five letters of the alphabets}
S={e, a, c, b, d} R and S are equal sets
Algebraic Set Notation
Sometimes a set may not be written with its elements listed out but as an algebraic sentence
Q = {x : x is a perfect square less than 50}
It can be read as “Q is a set of x such that x is a perfect square less than 50”
The members of set Q are {1, 4, 9, 16, 25, 36, 49}
K = {x : x ∈ Z, 5 ≤ x ≤ 11}
“K is a set of x such that x is an integer and is greater or equal to 5 but less than 11”.
K = {5, 6, 7, 8, 9, 10}
Union and Intersection of Sets
The union of two sets is another set that includes all the elements in the two sets
We use the symbol ∪ to represent union.
For example, A = {1, 3, 5, 7, 9} and B = {2, 3, 4, 5, 6}
A ∪ B = {1, 2, 3, 4, 5, 6, 7, 9}
The intersection of two sets is another set that includes those elements which can be found in both sets
It is represented by ∩
For example X = {a, e, i, o, u} and Y = {c, a, r, t, e} X ∩ Y = {a, e}
Complement of Sets
The complement of a set A, written as A′ or Ac, are those elements that belong to the universal set but not set A.
Example: Given a universal set U = {even numbers less than 15} and A = {2, 4, 10}, find Ac.
U = {2, 4, 6, 8, 10, 12, 14}
A = {2, 4, 10}
∴ Ac = {6, 8, 12, 14}
Example If U = {whole numbers less than 50 but greater than 20}, X = {perfect squares}, Y = {factors of 6}, Z = {prime numbers}, find the following
a) X ∪ Y (b) (X∩Y) ∪ Y′ (c) (X′ ∩ Y′) ∪ Z′ (d) n(X)
U = {21, 22, 23, 24, …49}
X = {25, 36, 49}, Y = {24, 30, 36, 42, 48}, Z = {23, 29, 31, 37, 43, 47}
X ∪ Y = {24, 25, 30, 36, 42, 48, 49}
X ∩ Y = {36}
Y′ = {21, 22, 23, 25, 26, 27, 28, 29, 31, 32, 33, 34, 35, 37, 38, 39, 40, 41, 43, 44, 45, 46, 47, 49}
(X ∩ Y) ∪ Y′ = {21, 22, 23, 25, 26, 27, 28, 29, 31, 32, 33, 34, 35, 36, 37, 38, 39, 40, 41, 43, 44, 45, 46, 47, 49}
U = {21, 22, 23, 24,…49}
X = {25, 36, 49}
Y = {23, 29, 31, 37, 43, 47}
X′ = {21, 22, 23, 24, 26, 27, 28, 29, 30, 31, 32, 33, 34, 35, 37, 38, 39, 40, 41, 42, 43, 44, 45, 46, 47}
Z′ = {21, 22, 24, 25, 26, 27, 28, 30, 32, 33, 34, 35, 36, 38, 39, 40, 41, 42, 44, 45, 46, 48, 49}
(X′ ∩ Y′) ∪ Z′ = {21, 22, 24, 25, 26, 27, 28, 30, 32, 33, 34, 35, 36, 38, 40, 41, 42, 44, 45, 46, 48}
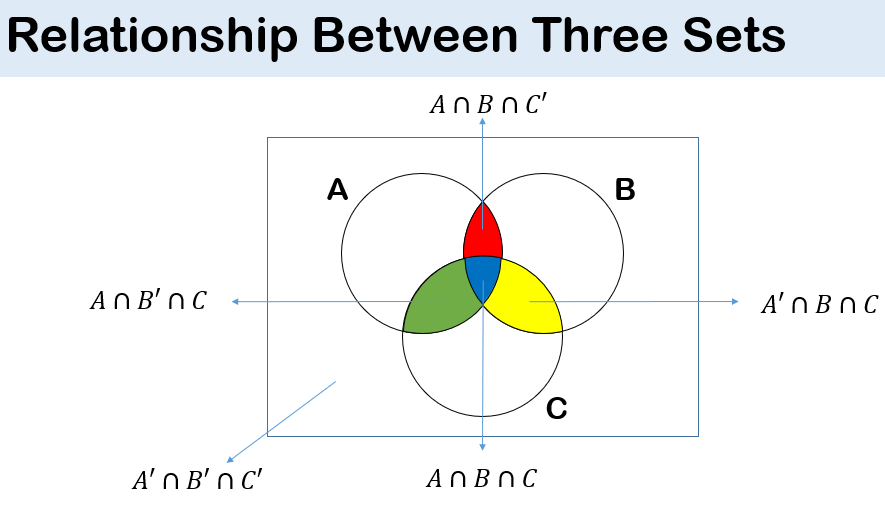
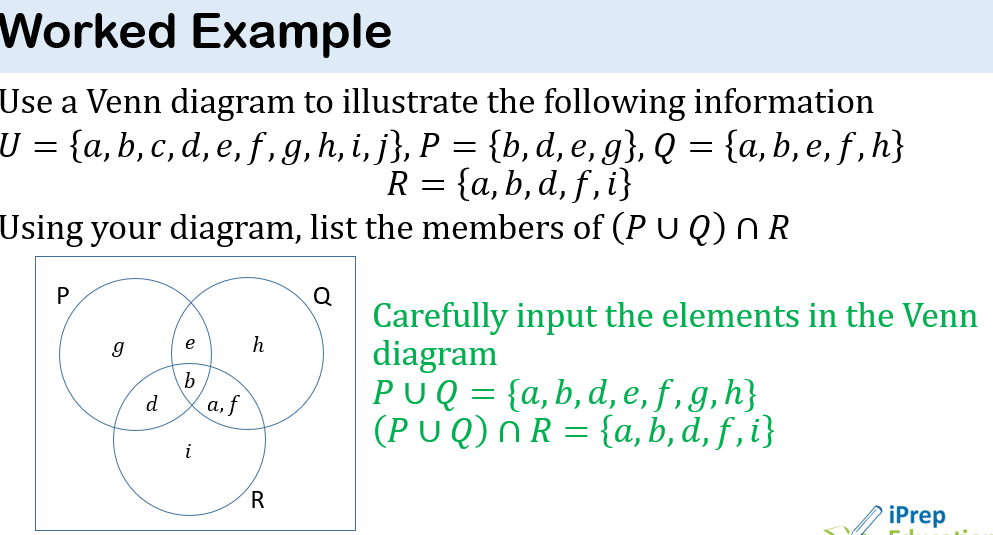
Venn Diagrams
A geometric interpretation of sets using diagrams which show the relationship between set is a called a Venn diagram.
In a Venn diagram,
• The rectangle is the universal set,
• The circles or oval shapes represent the subset
• If the circles overlap, it shows intersection
Venn Diagrams and their representations

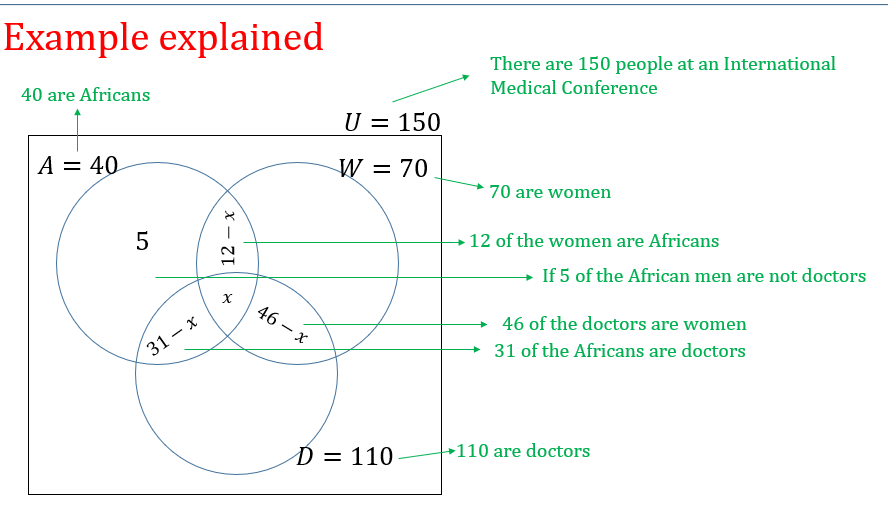
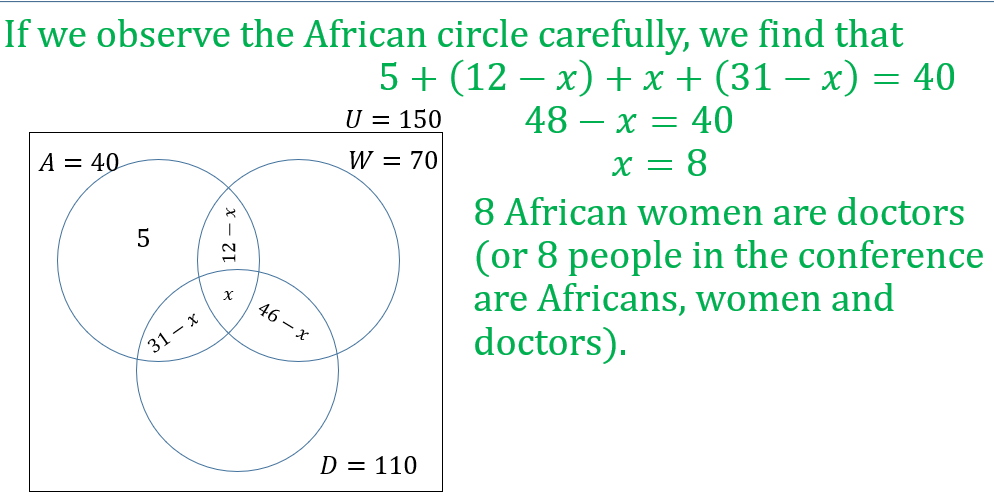
Worked Example
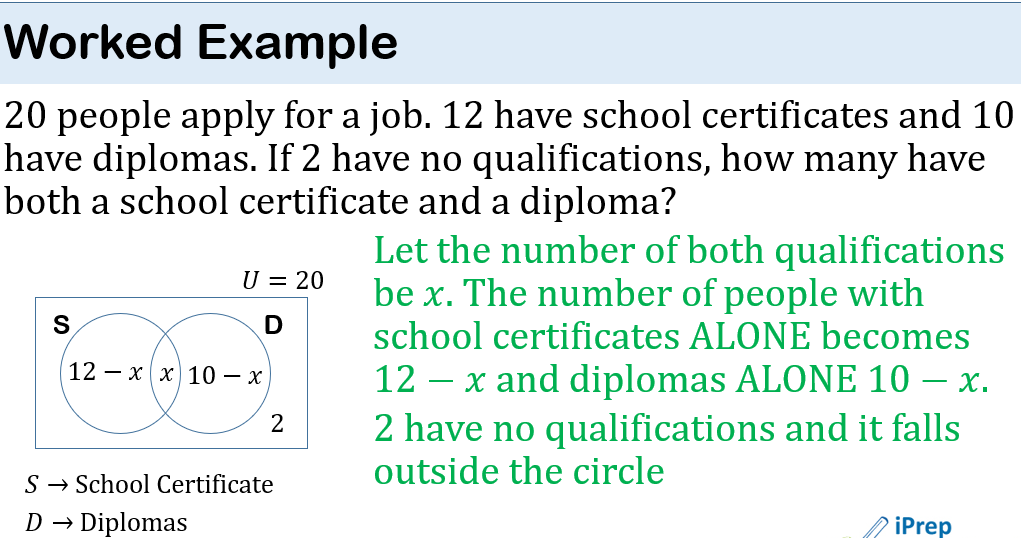
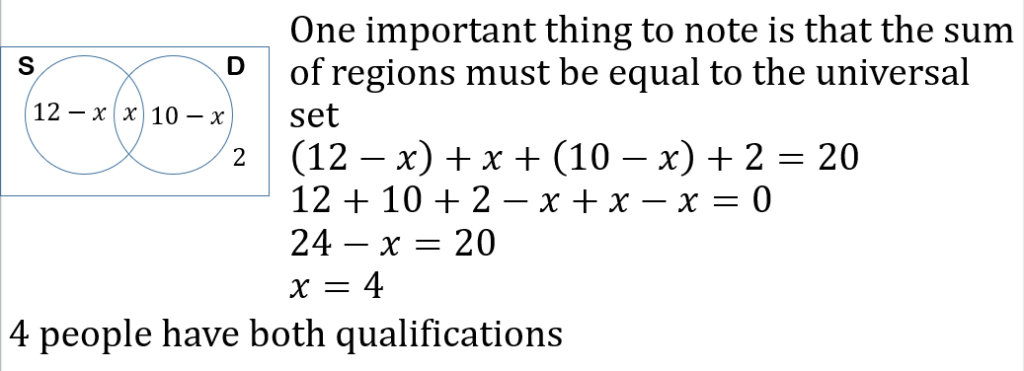
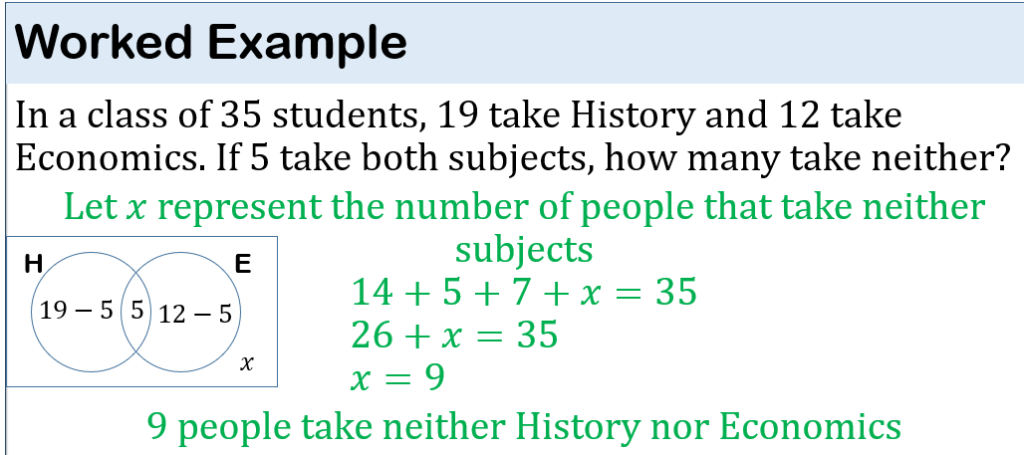
There are 150 people at an International Medical Conference. 40 are Africans, 70 are women and 110 are doctors. 12 of the women are Africans, 46 of the doctors are women and 31 of the Africans are doctors. If 5 of the African men are not doctors,
a) how many of the African women are doctors?
b) how many of the men are neither Africans nor doctors?

BINARY OPERATIONS
A binary operation on a set is a calculation involving two elements of the set (called operands) and producing another element of the set.
Binary operation range from the elementary operation of addition, subtraction, multiplication and division to vector addition or multiplication.
Symbols such as ∆, *, ∇, ⊕, ⊙, ⊗
are used to represent and perform operations in binary. For example, on the set of natural numbers N, the addition of two numbers is a binary operation, that is, if a and b are natural numbers, then a+b is a natural number
Properties of Binary Operations
Closure Property
A binary operation * is said to be closed on a set S whenever a and b are elements of S (a∈S and b∈S) and then a∗b is also an element of S.
For example, if E is a set of even numbers, is the binary operation “addition” closed under E?
E={even numbers}={2, 4, 6, 8, 10, 12, 14, ..}
If we pick any two elements of E and combine them under the given operation of addition, do we still get an even number?
2+4=6, 8+10=18, 14+16=30
We see that the results always give an even number. Hence the operation addition is closed under a set of even numbers
Commutative Property
A binary operation * is commutative if
a∗b=b∗a
This means that the result of two numbers combined together under the operation will be the same no matter how the numbers are grouped.
For example, addition and multiplication of real numbers are commutative
2+3=3+2=5
3×4=4×3=12
Associative Property
If a binary operation * is associative, then
a∗(b∗c)=(a∗b)∗c
Addition and multiplication of real numbers are associative;
3+(5+7)=(3+5)+7
2×(4×6)=(2×4)×6
But subtraction is not associative.
8-(5-1)≠(8-5)-1
“since” 4≠2
Distributive Property
A binary operation is said to be distributive if
a∗(b∗c)=(a∗b)∗(a∗c)
or using two symbols
a∗(b ∆ c)=(a∗b) ∆ (a∗c)
For example: 2×(3+5)=(2×3)+(2×5)
16=16
2+(3×5)≠(2+3)×(2+5)
17≠42
Identity and Inverse Element
A binary operation * is said to have an identity element e if
a∗e=e∗a=a
e will be used generally to represent the identity element
From the above relation, we can deduce that for an identity element to exist, the binary operation must be commutative.
Let us now attempt to find the identity element for addition and multiplication
If we consider the operation 5∗e
where * represents addition, then 5+e=e+5
commutative property satisfied
Now if 5+e=e+5=5
Then e=0
Hence the identity element under addition is 0.
Can you determine the identity element under the operation multiplication of a set of real numbers?
Since 6×e=e×6
and where 6×e=6→e=1
The identity element of multiplication is 1
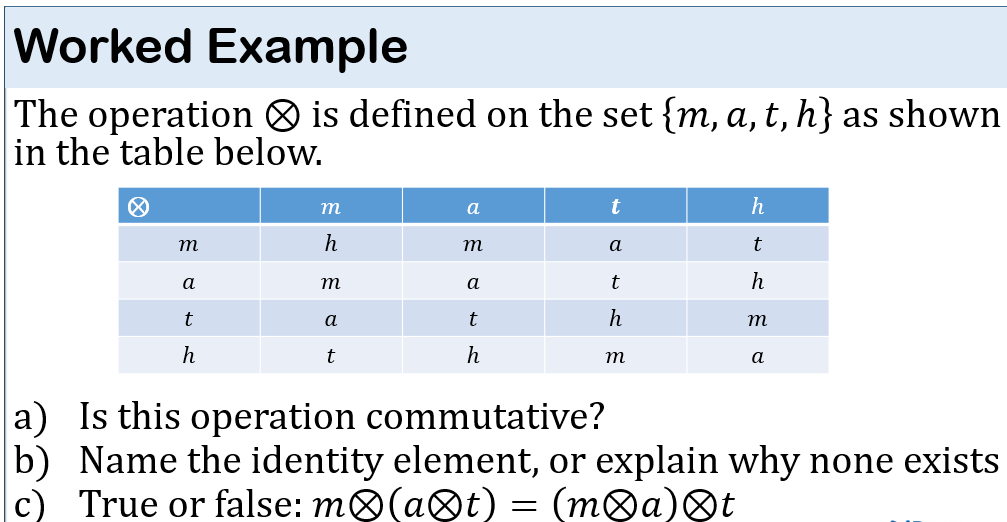
Worked Example
The operation is commutative because by observation, we see that
m⊗a=a⊗m, m⊗t=t⊗m, m⊗h=h⊗m
(observe other combinations such as t⊗h, a⊗t)
Identity conditions: a∗e=e∗a=a
When any letter (m, a, t, h) is combined with a, the result is always the former, that is
m⊗a=m, a⊗a=a, t⊗a=t, h⊗a=h
Hence a is the identity element
c) m⊗(a⊗t)=(m⊗a)⊗t
m⊗t=m⊗t
a=a
TRUE
Inverse element
An element in a set can only have an inverse if the set has an identity element e with respect to the binary operation
This simply means that an element a in a set S will have an inverse a-1 with respect to a binary operation * if
a∗a-1=a-1∗a=e
For example, if the set S is a set of real numbers, what is the inverse of 7, where the operation * represents multiplication
7×e=e×7=7
e=1
Now if 7×a-1=a-1×7=1 Then a-1=1/7
Note that if the set S was a set of integers, 7 will have no inverse because
7×a^(-1)≠a^(-1)×7=1
And a^(-1)≠1/7 since this is not an integer
Worked Example
A binary operation * on the set of real numbers is defined by x∗y=xy/3 for all x, y∈R. Find the inverse of -5.
x∗y=xy/3
The operation is commutative because x∗e=xe/3
“is the same” as e∗x=ex/3
Now if x∗e=x, that is, xe/3=x
then xe=3x and e=3
Recall inverse condition: a∗a-1=e
-5∗a-1=(-5a-1)/3=3
a-1=-9/5
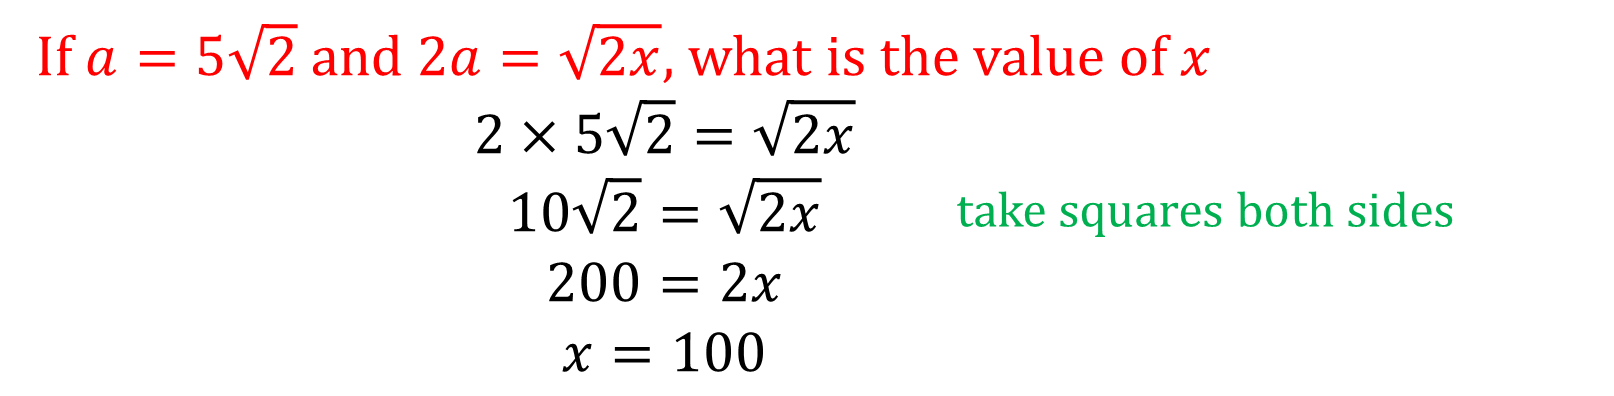
SURDS
A number whose square root gives a whole number is called a perfect square.
For example, 4, 9, 16, 25, 36 are perfect squares, because their square roots equal 2, 3, 4, 5, 6 respectively.
When the square root is not a whole number, we refer to it as a surd
For example,

Laws of Surds

Recall from indices that

Verify this yourself by putting a = 2 and b = 3
Simplification of Surds
Surds can be simplified by
breaking the number into a product of two factors where one of them is perfect square and then applying the laws of surds
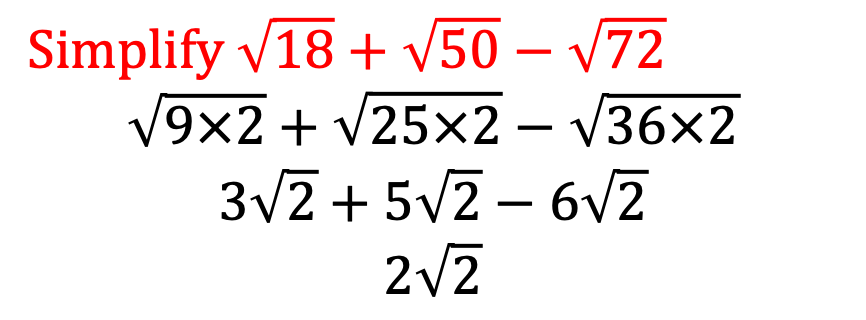
Example: Simplify the following surds


Addition and Subtraction of Surds
Surds can be added or subtracted together if and only if they have the same basic form.
For example


Worked Example
PRACTICE


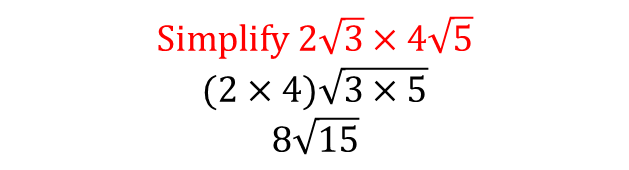
Multiplication of Surds
Surds can be multiplied together by multiplying number for number and surd for surd
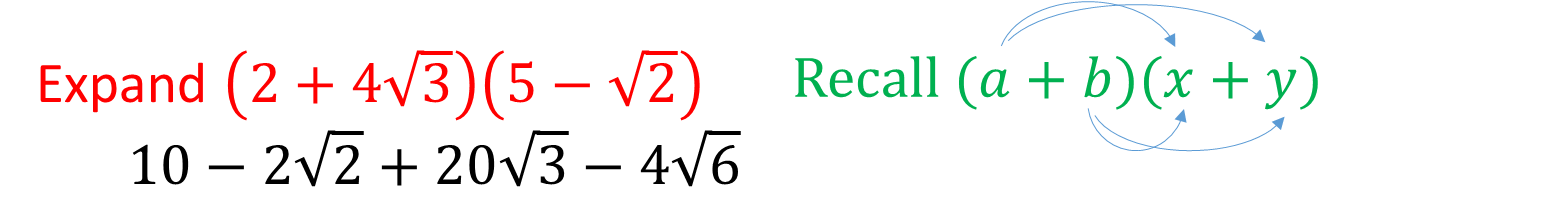
Example
Example
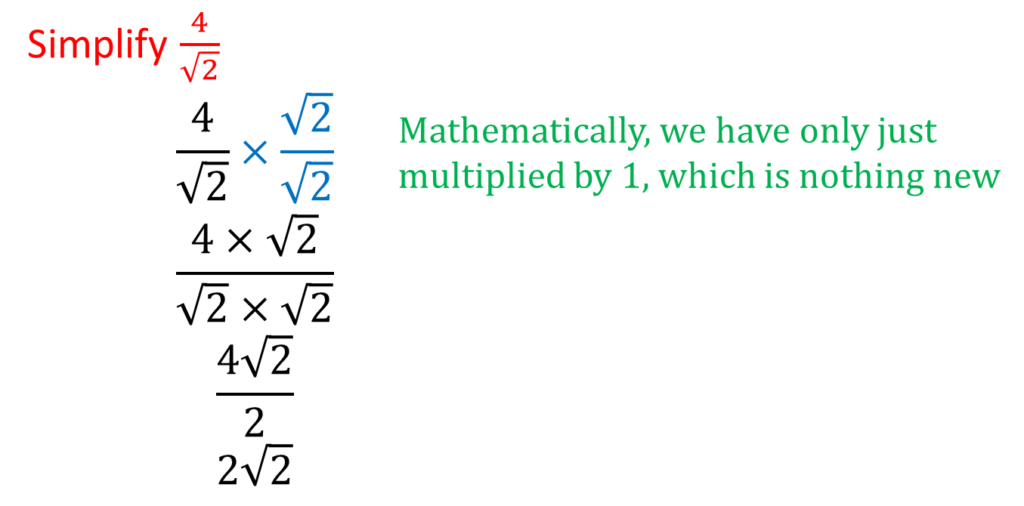
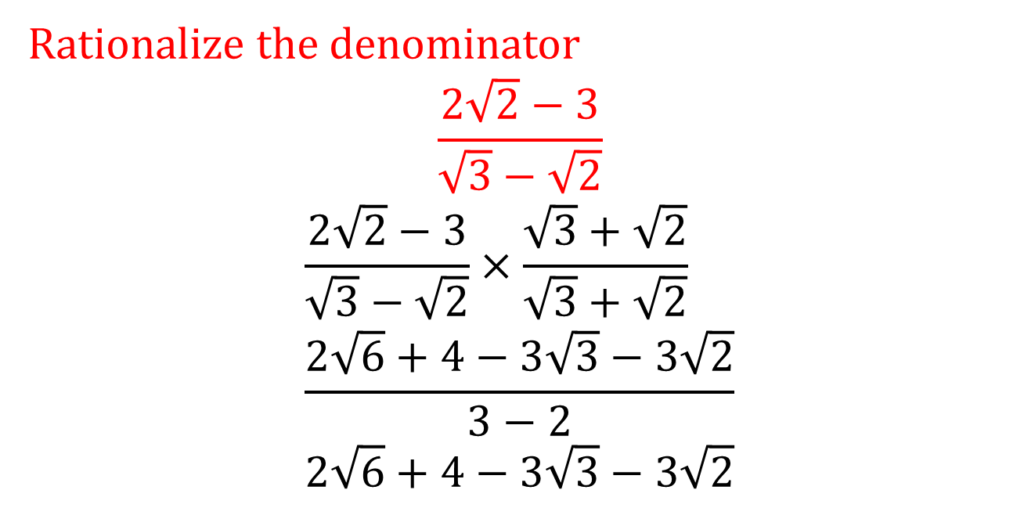
Division of Surds
It is not normal practice to have a surd as the denominator of a fraction. To remove the surd, multiply by another surd that would make the denominator a whole number. This is called rationalizing the denominator
Example
Example
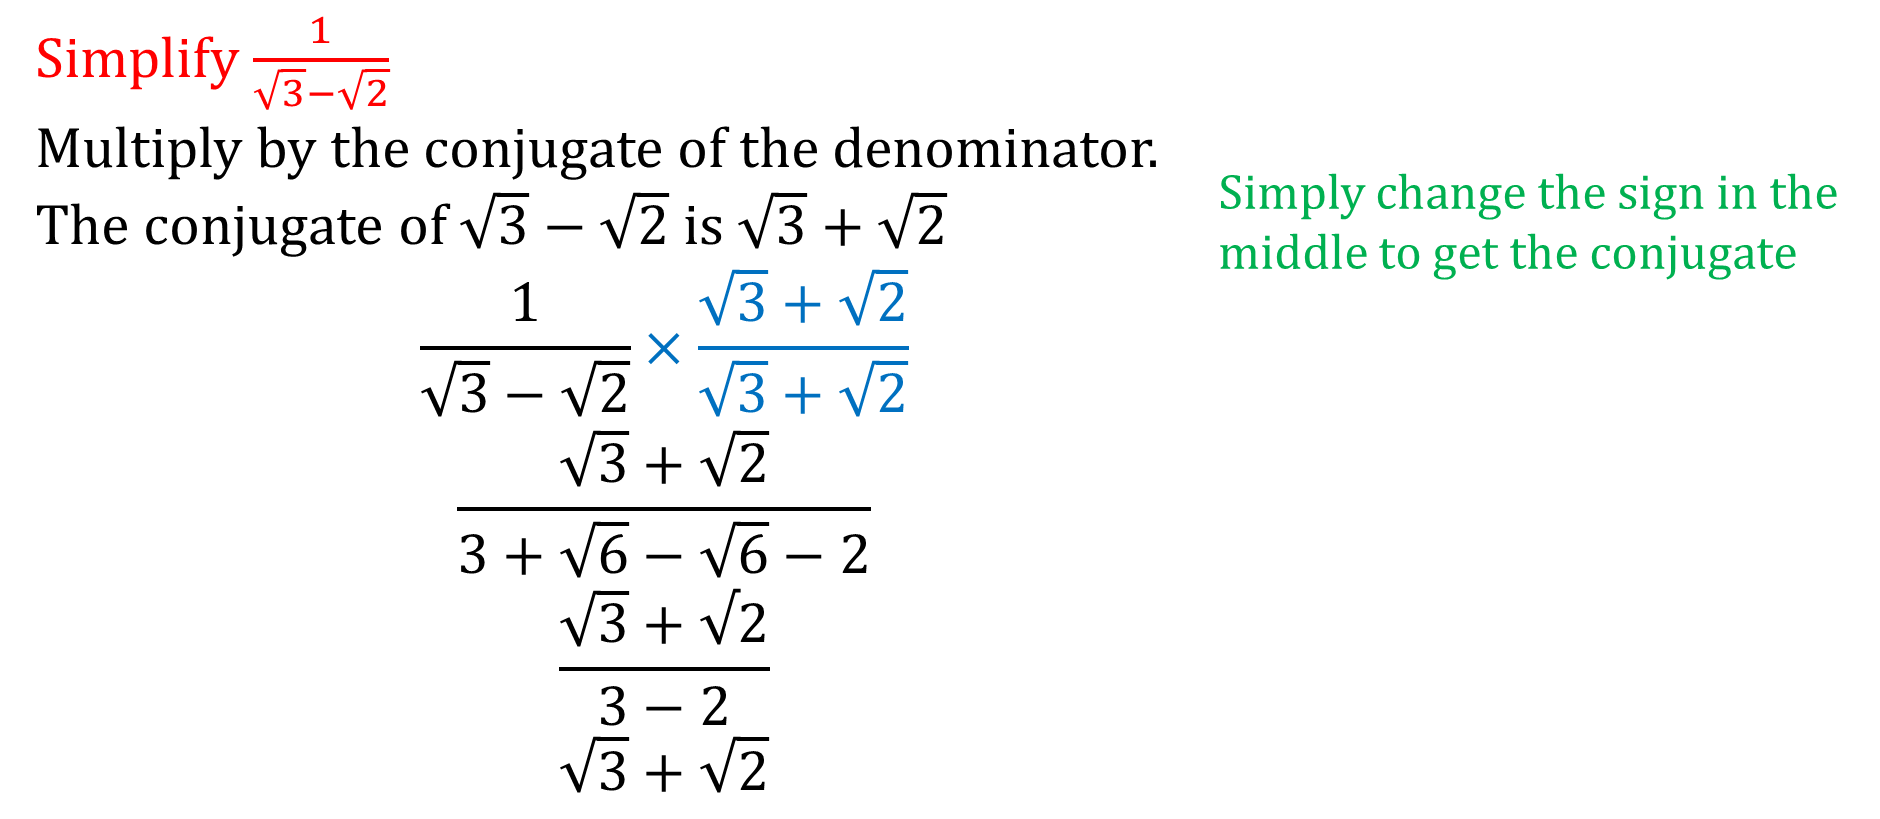
Worked Examples

EXERCISES

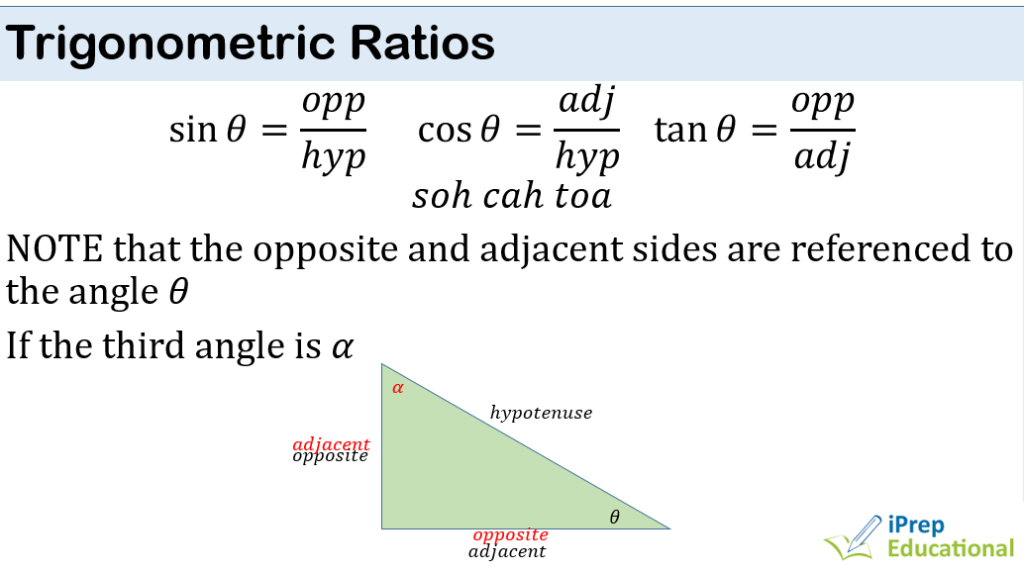
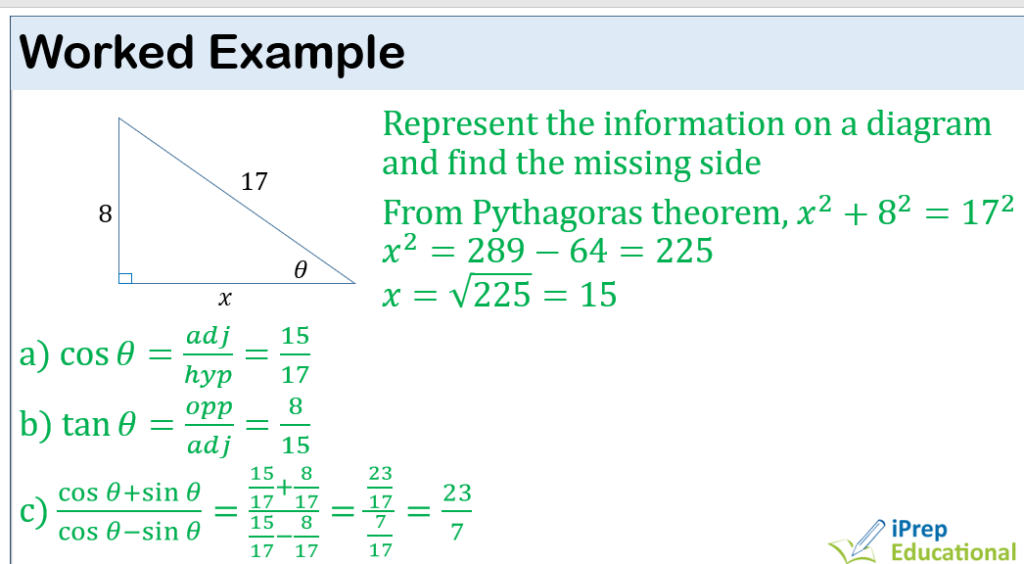
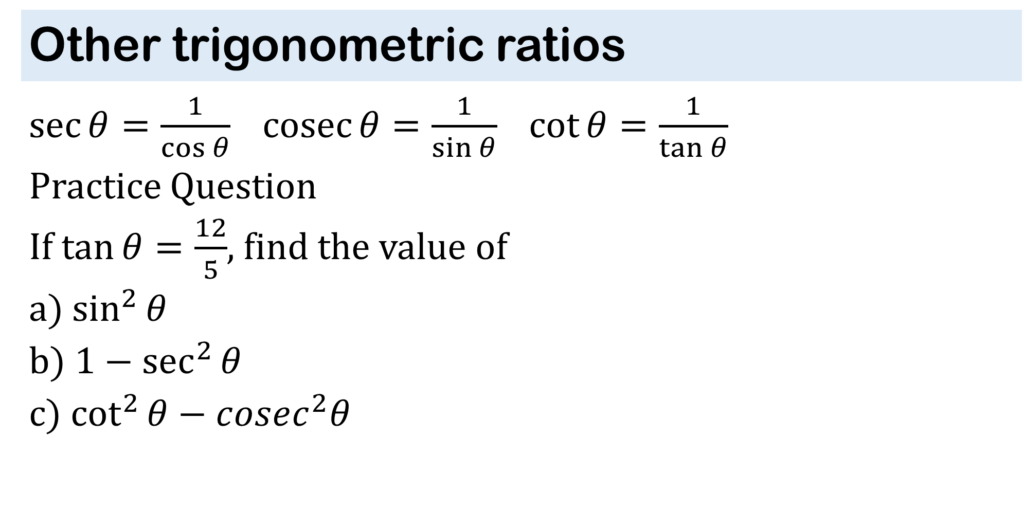
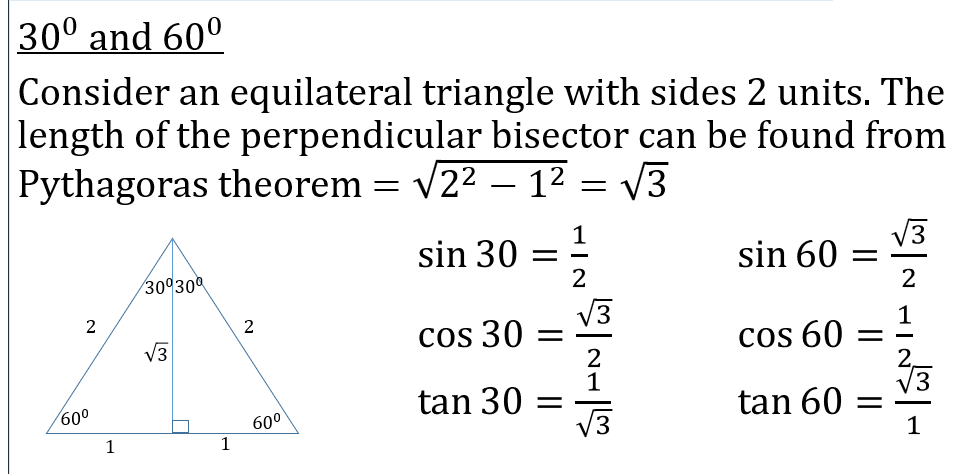
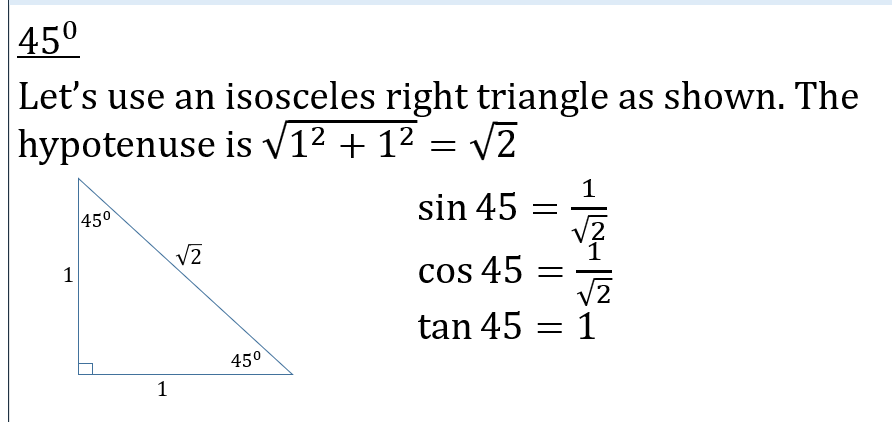
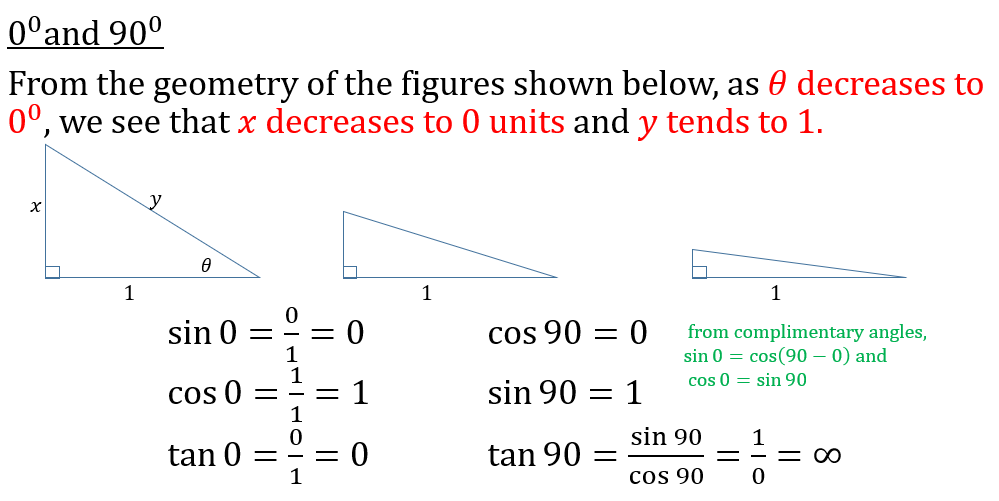
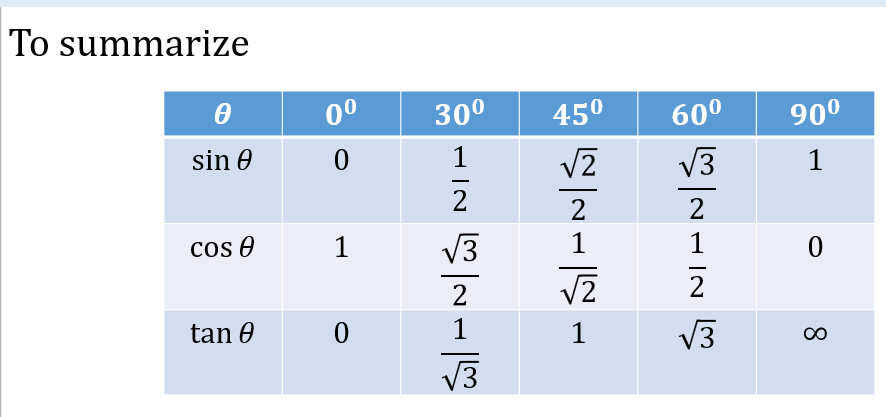
TRIGONOMETRY


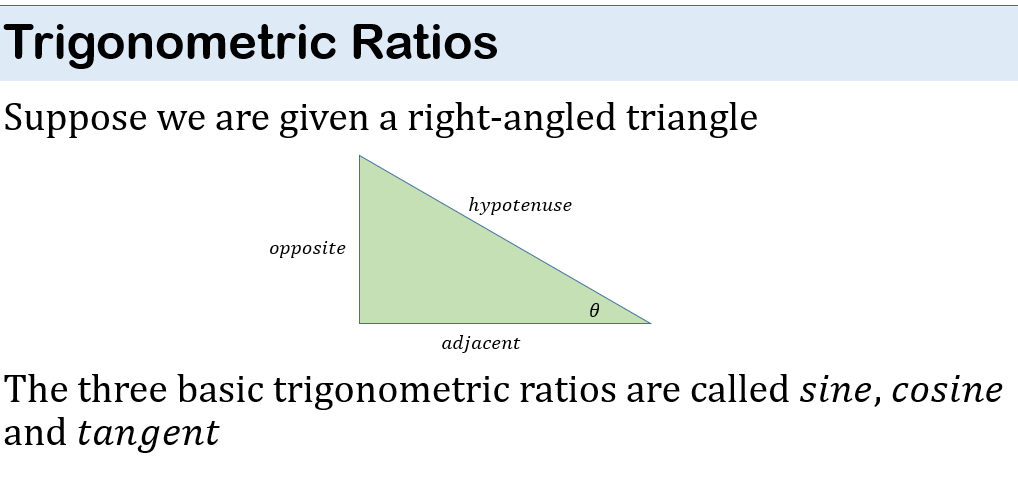


PLANE & CIRCLE GEOMETRY
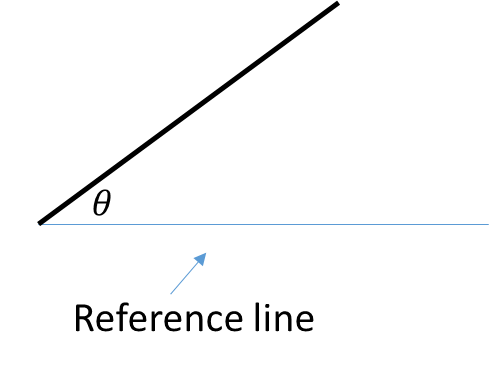
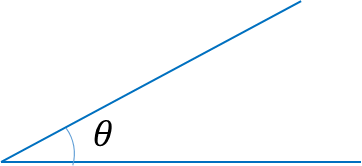
Angles
An angle measures the rotation of a line from a reference line
Types of Angles
1. Acute angle: it is an angle less than 900
2. Obtuse angle: it is an angle greater than 90^0 but less than 1800

3. Reflex angle: this is an angle greater than 180^0 but less than 3600

4. Right angle: it is an angle of exactly 900
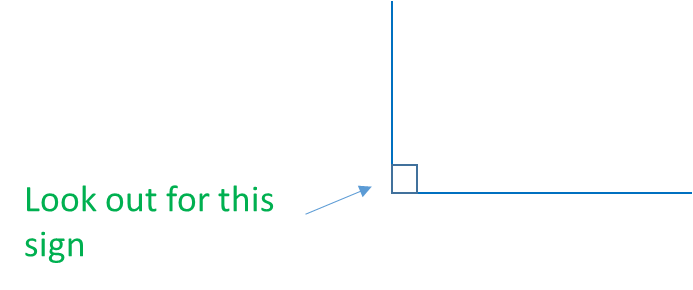
5. Straight angle: this is an angle in a straight line (= 1800)

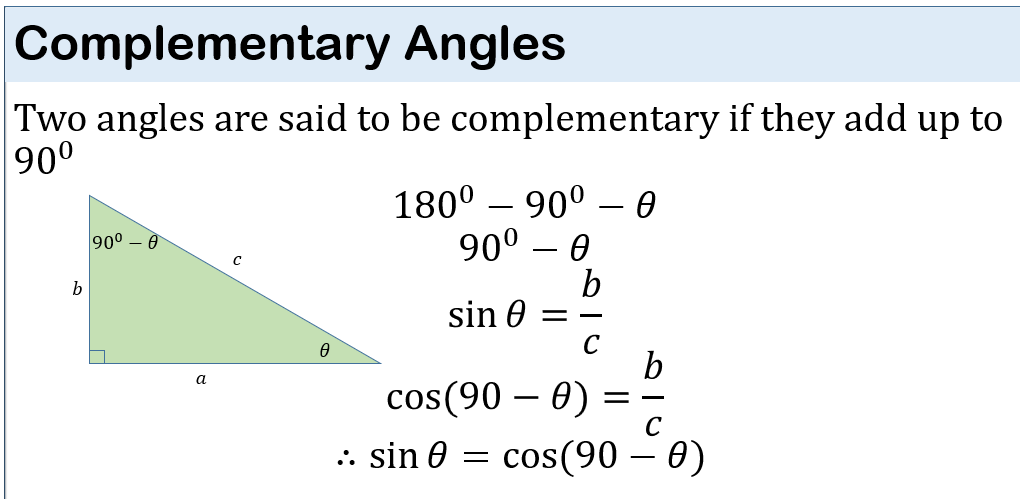
6. Complementary angles: two angles are said to be complementary if they add up to 900
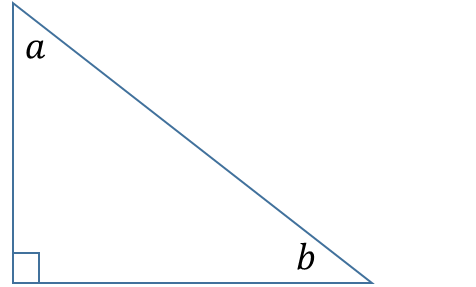
a and b are complementary angles (because a + b = 900)
7. Supplementary angles: they add up to 1800. The adjacent angles of a parallelogram are supplementary

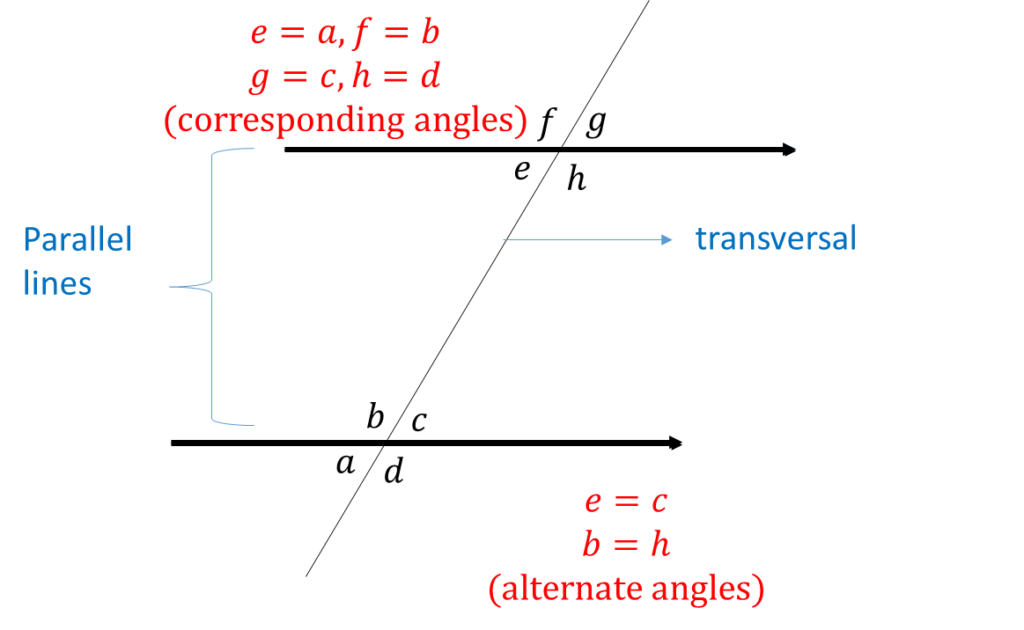
Parallel Lines
Parallel lines are lines that don’t meet. A transversal cuts 2 parallel lines
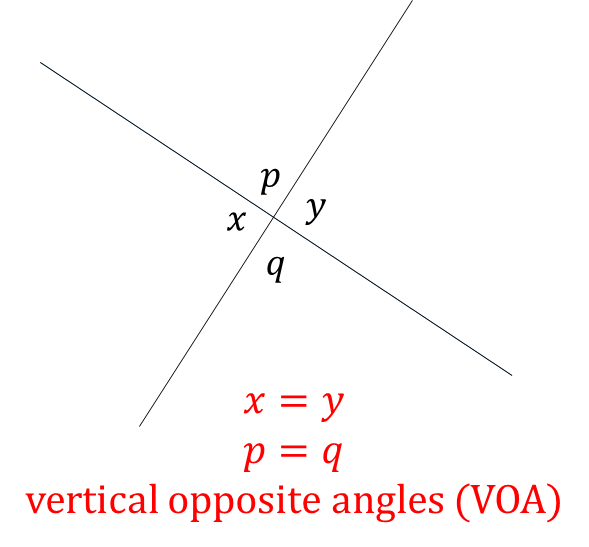
Vertical Opposite Angles
Example: Find the lettered angles a, x and y

y + 115 = 1800 (angle on a straight line)
y = 180 – 115 = 650
a = y = 650 (corresponding angles)
x = a = 650 (alternate angles)
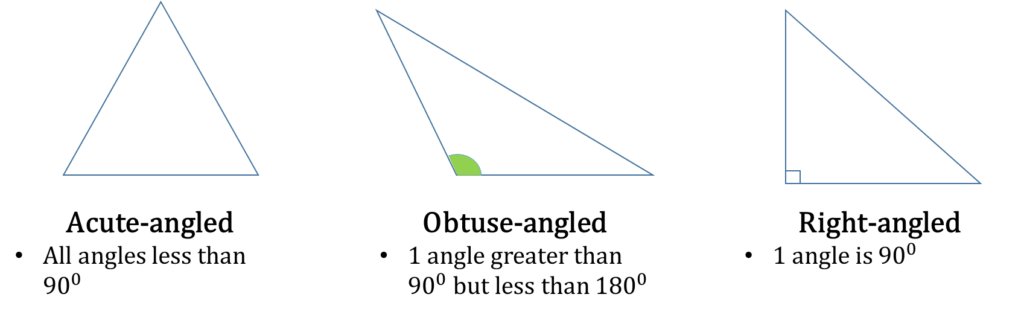
Triangles
A triangle is three-sided shape. Let’s group triangles based on their angles and sides
Sides
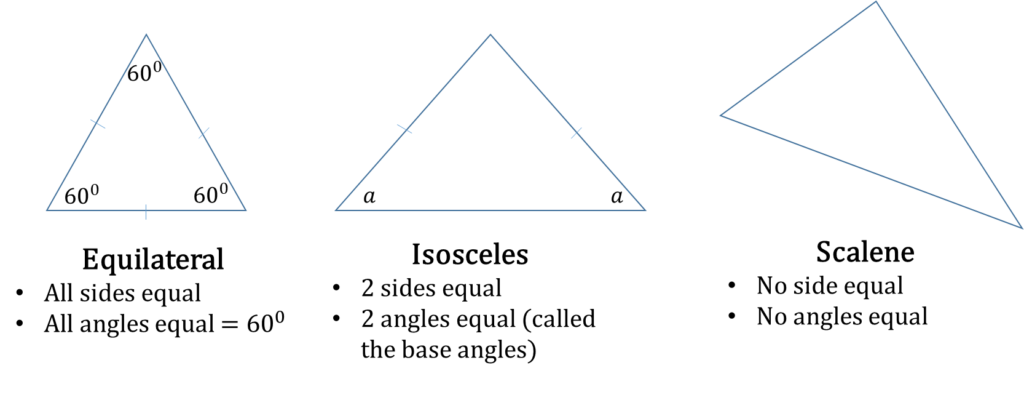
Angles
Theorems related to triangles
The sum of angles in a triangle is equal to 1800
a + b + c = 1800
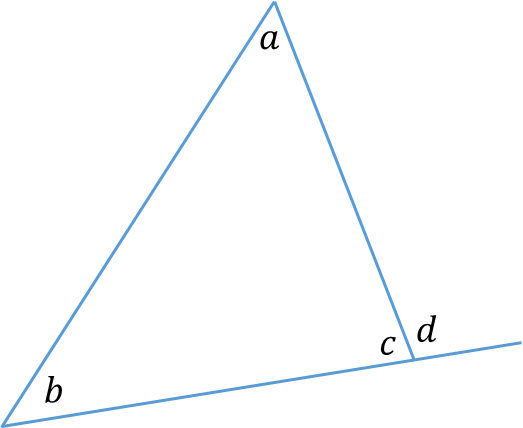
The external angle of a triangle is equal to the sum of the internal opposite angles
d = a + b
Example: In the diagram, ∠PQR = 1250, ∠QRS = r, ∠RST = 800 and ∠STU = 440. Calculate the value of r
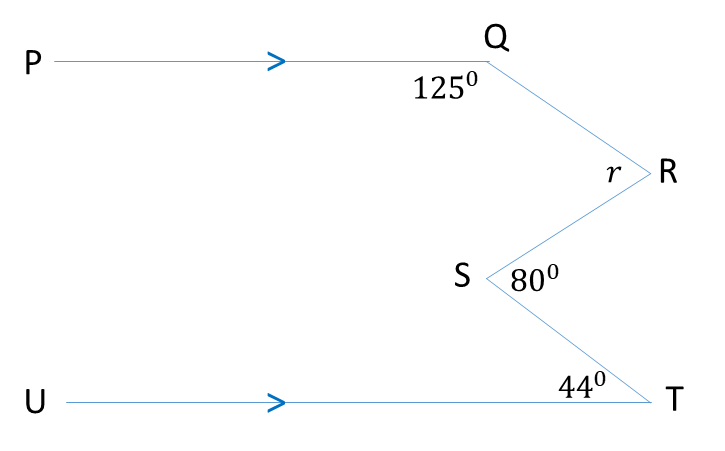
Let’s make some modifications to the diagram
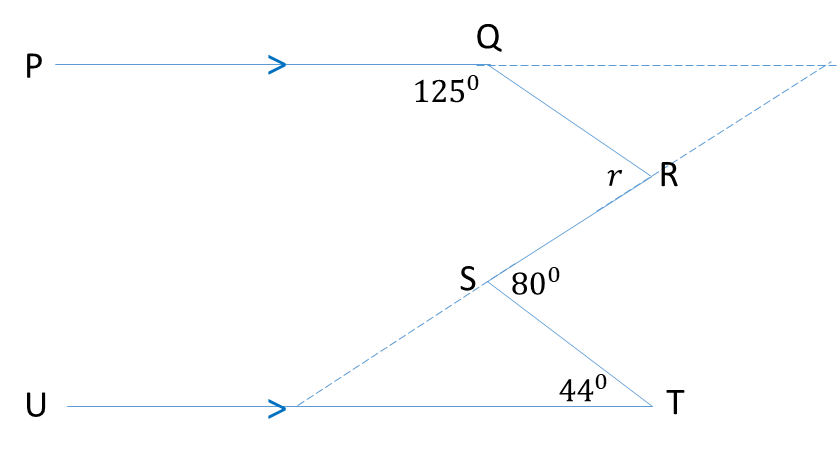
b = 180 – 125 = 550 (angles on a straight line)
80 = 44 + a (ext. ∠= sum of opp. int. ∠s)
a = 360
c = a = 360 (alternate angles)
r = b + c = 55 + 36 = 910
Congruent and Similar triangles
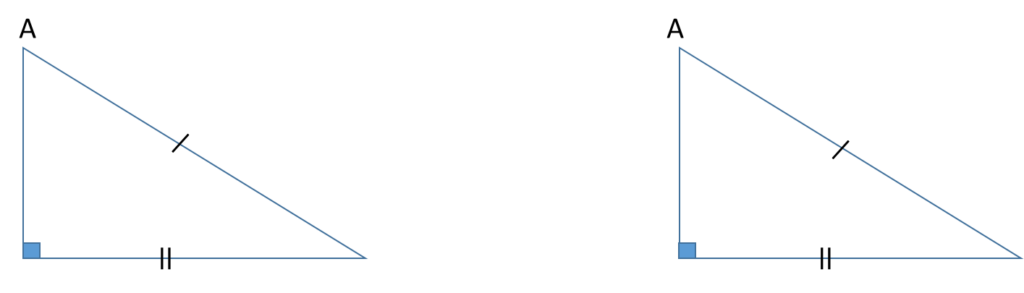
Two triangles are said to be congruent if they are exactly the same size and shape.
Conditions for Congruency
1) Two sides and an angle between (called included angle) in 1 triangle is equal to two sides and the included angle in the other triangle

This can easily be remembered as SAS (Side Angle Side)
2) Two angles and a corresponding side in one triangle is equal to two angles and corresponding side in the other triangle
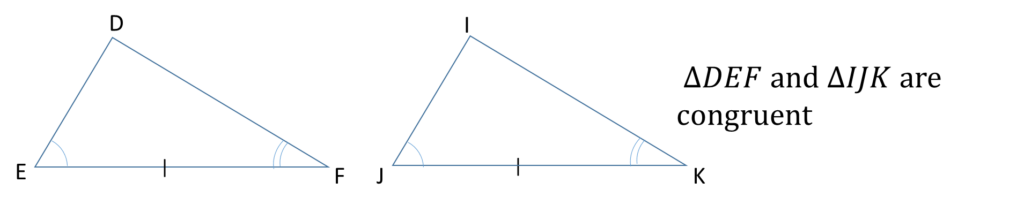
This can easily be remembered as ASA (Angle Side Angle)
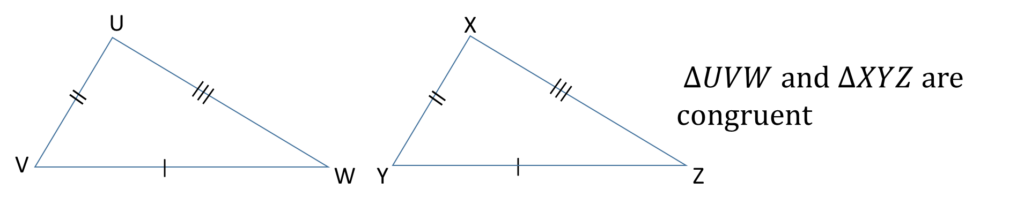
3) Three sides in one triangle is the same as the three sides in the other triangle. SSS (Side Side Side)
4) The right angle, hypotenuse and side is equal to the right angle, hypotenuse and side
When naming congruent triangle, it’s important to give the letters in the correct order
Example

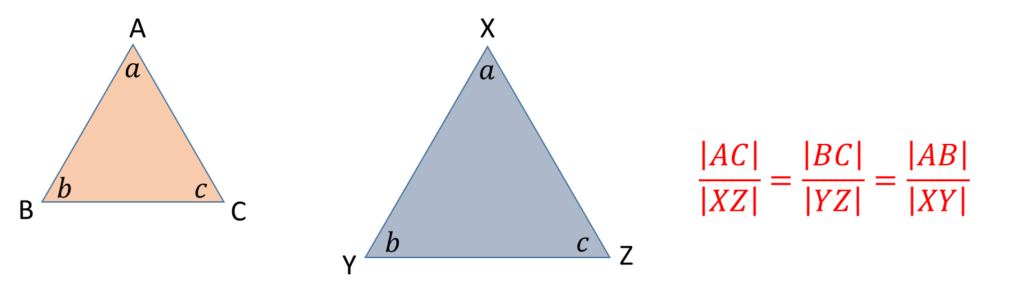
Similar Triangles
Two triangles are said to be similar if they have the same angles but different sizes.
Theorem: If two triangles are similar, then the ratio of their corresponding sides are equal.
Example: A summer camp counselor wants to find a length, x, in feet, across a lake as represented in the sketch. The lengths represented by AB, EB, BD and CD on the sketch were determined to be 1800 feet, 1400 feet, 700 feet, and 800 feet, respectively. Segments AC and DE intersect at B, and ∠AEB and ∠CDB have the same measure. What is the value of x?
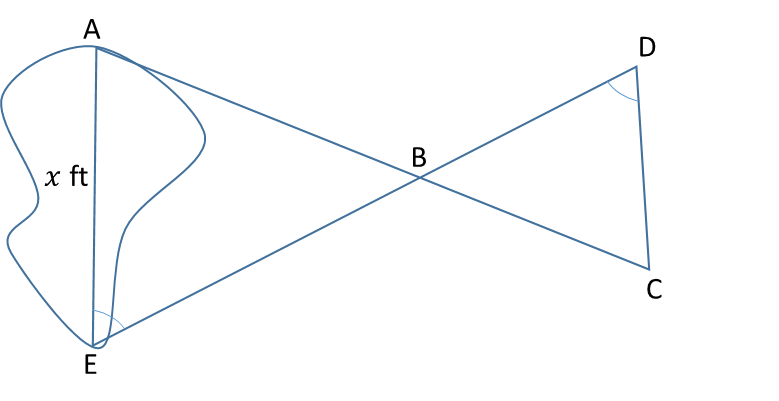
From the geometry of the figure, ∆ABE is similar to ∆CBD because ∠ABE = ∠CBD, ∠AEB = ∠CDB and ∠EAB = ∠DCB

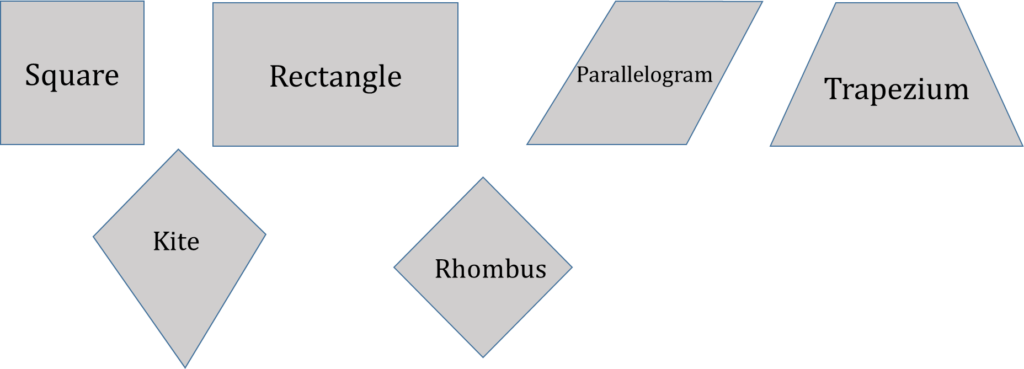
Quadrilaterals
A quadrilateral is a four-sided figure.
The sum of angles in a quadrilateral is equal to 3600
Polygons
5 sides=pentagon
6 sides=hexagon
7 sides=heptagon
8 sides=octagon
9 sides=nonagon
10 sides=decagon

The sum of angles of a polygon is given as
S=180^0 (n-2)
or 2n-4 right angles
Where n is the number of sides
For example, the sum of angles of a regular pentagon (regular means all sides and angles are equal) is 180(5-2) = 5400
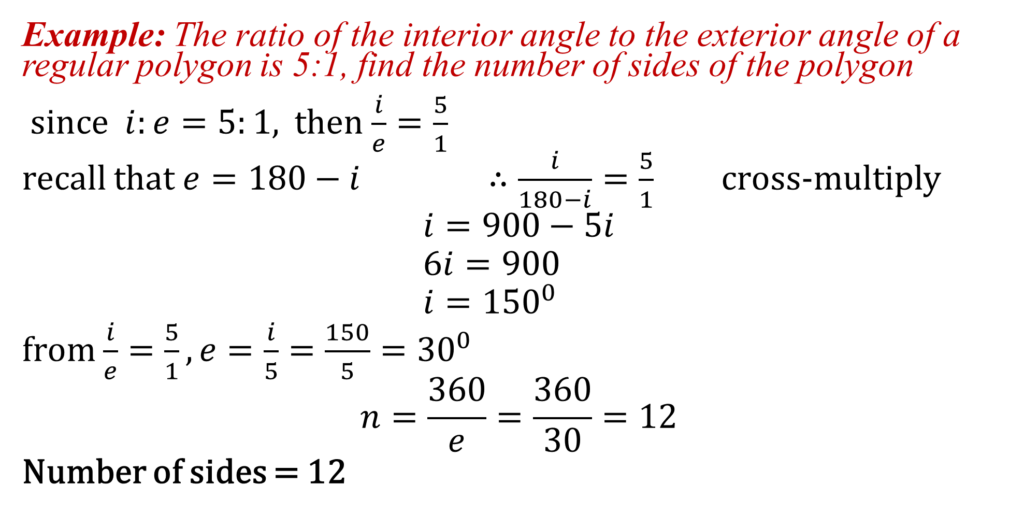
Each angle therefore will be equal to 540/5 = 1080
The external angle e, the internal angle i, and the number of sides n are related as follows

e = 180-i
e = 360/n
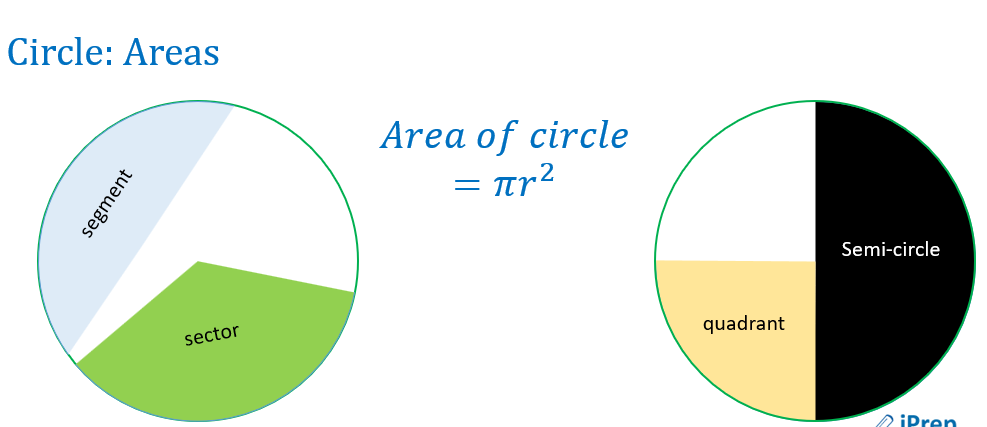
Circle Geometry
Lines of a circle

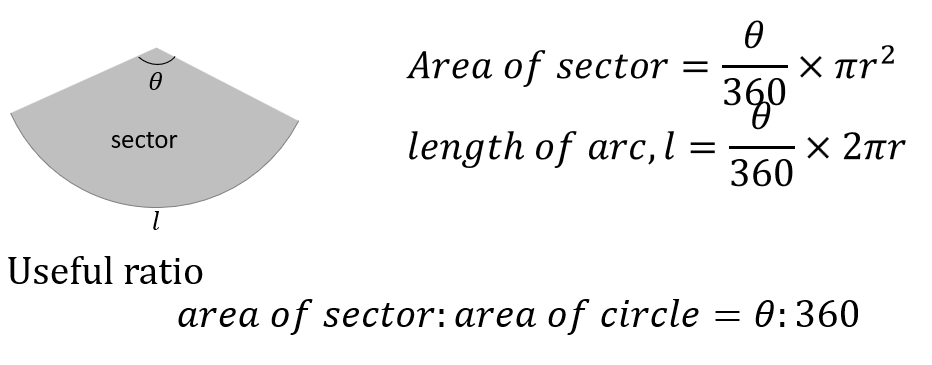
Areas of a circle

Theorems related to circles
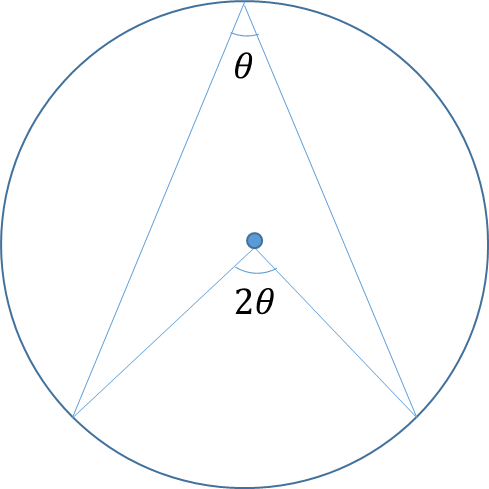
The angle an arc subtends at the centre of the circle is
twice the angle it makes at
the circumference
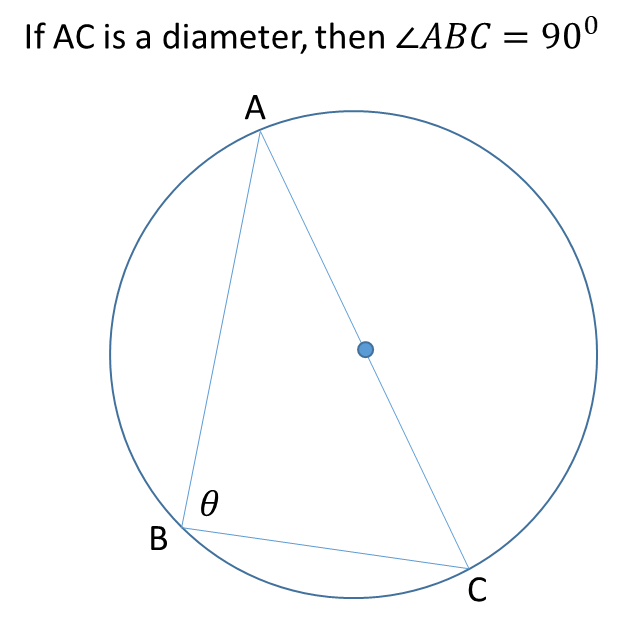
The angle in a semi-circle = 900
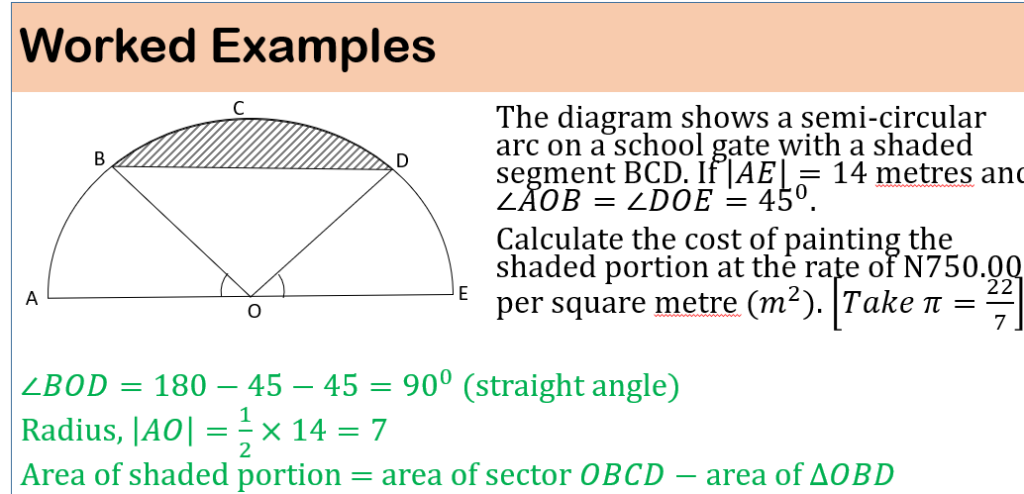
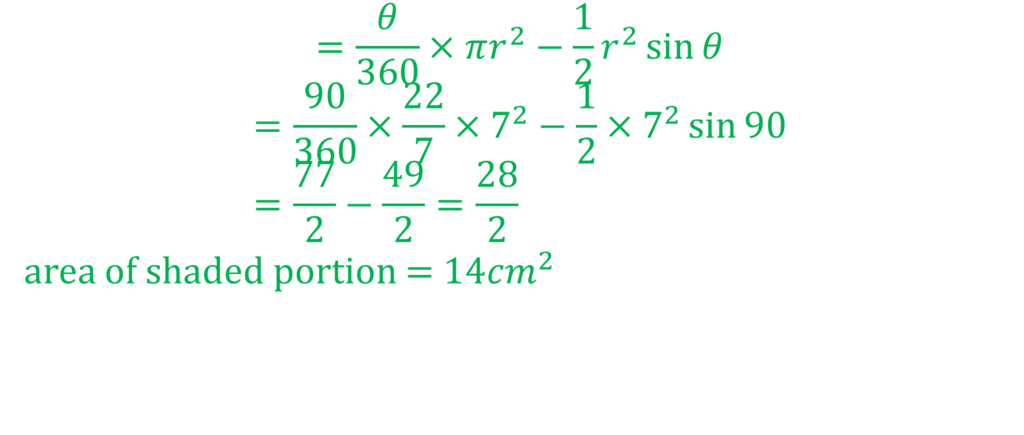
Example: In the diagram, QOS is a diameter, ∠RQS = x0 and ∠QST = (3x+15)0. Find:
(i) the value of x
(ii) ∠RSQ
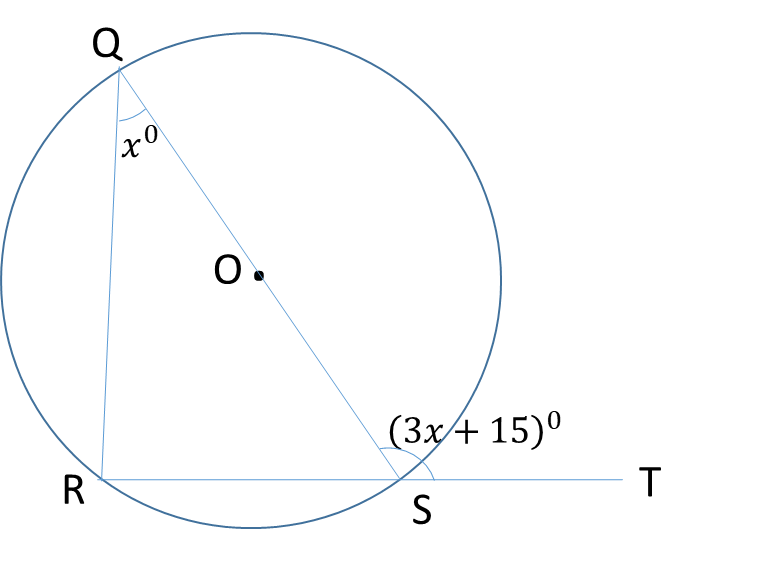
∠QRS = 900 (∠ in a semi-circle)
3x + 15 = 90 + x (ext ∠ of a ∆ = sum of interior opposite ∠s)
2x = 75
x = 37.50
∠RSQ = 180-90-x (sum of ∠s in a ∆)
∠RSQ = 90-37.5 = 52.50
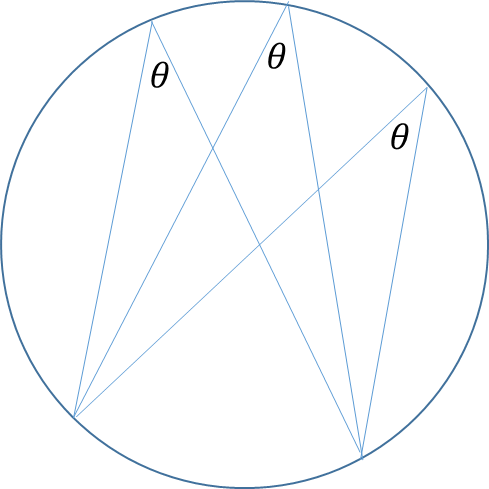
Theorem: Angles in the same segment are equal.
Angles subtended by the same
chord/arc at the circumference
are equal
Example: In the diagram, |VZ|=|YZ|, ∠YXZ = 200 and ∠ZVY = 520. Calculate the size of ∠WYZ
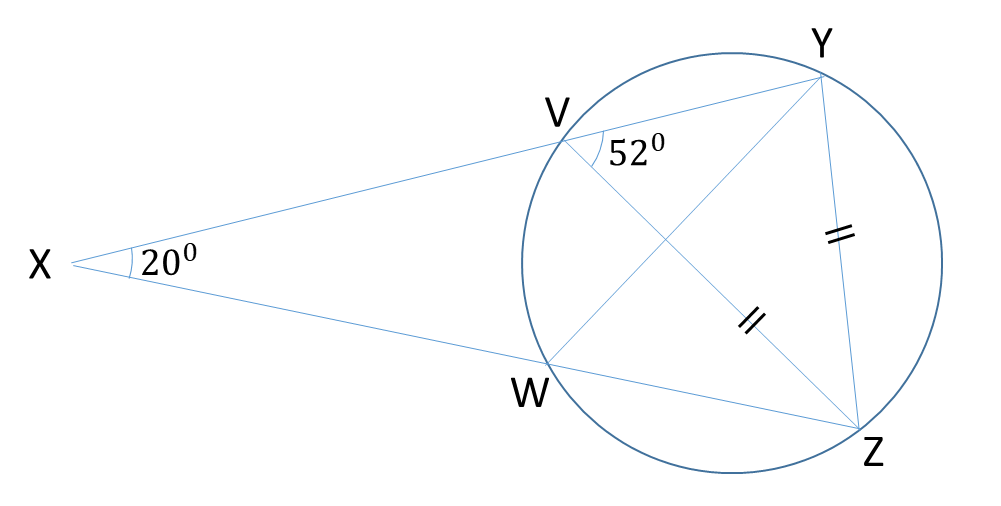
∠ZVY = ∠ZYV = 520 (base ∠s of an isosceles ∆)
∠ZWY = 520 (∠ in the same segment)
∠XZY = 180-20-∠ZYV (sum of ∠s in a ∆)
∠XZY = 160-52 = 1080
∠WYZ = 180-∠YWZ-∠YZW = 180-52-108
∠WYZ = 200
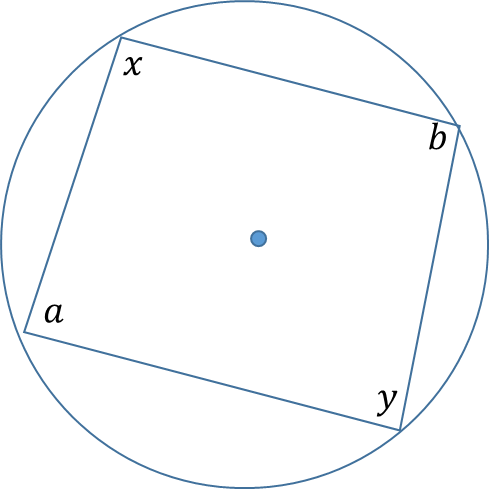
Cyclic Quadrilateral
A cyclic quadrilateral is a quadrilateral whose 4 vertices touch the circle
Theorem:
Opposite angles of a cyclic
quadrilateral are supplementary
a + b = 1800, x + y = 1800
Example: In the diagram, O is the centre of the circle, |PQ| = |QR| and ∠PSR = 560. Find ∠QRS

Let’s make some modifications to the diagram
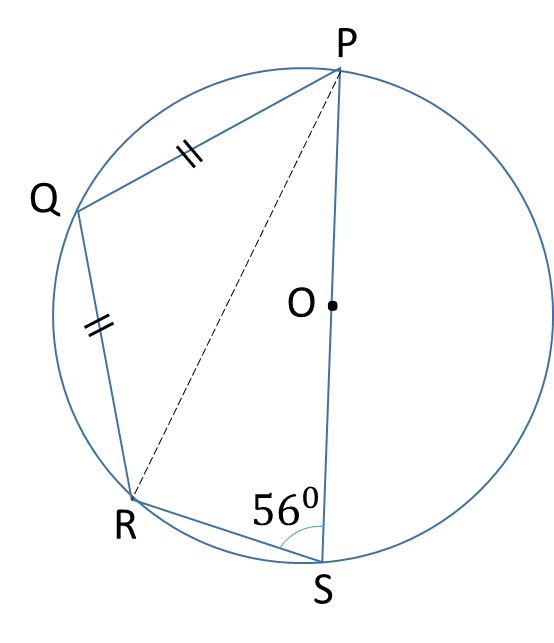
∠PRS = 900 (∠ in a semi-circle)
∠PQR = 180-56 = 1240 (opp. ∠ of a cyclic quad.)
∠QRP = ∠QPR = 1/2 (180-124) (base ∠ of an isosceles ∆)
∠QRP = 1/2 (56) = 280
∠QRS = 90 + 28 = 1180
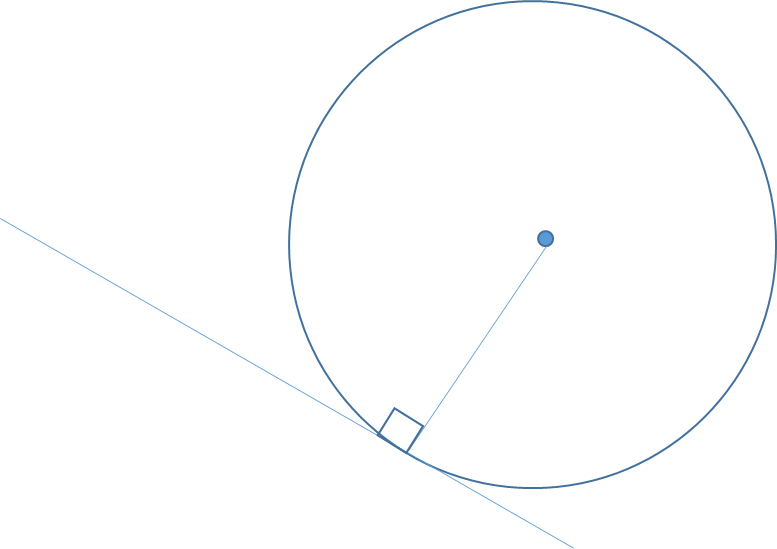
Tangent
A tangent is a line that touches a circle at 1 point only.
Theorem:
A line drawn from the contact
point to the centre of a circle
will be perpendicular to the
tangent
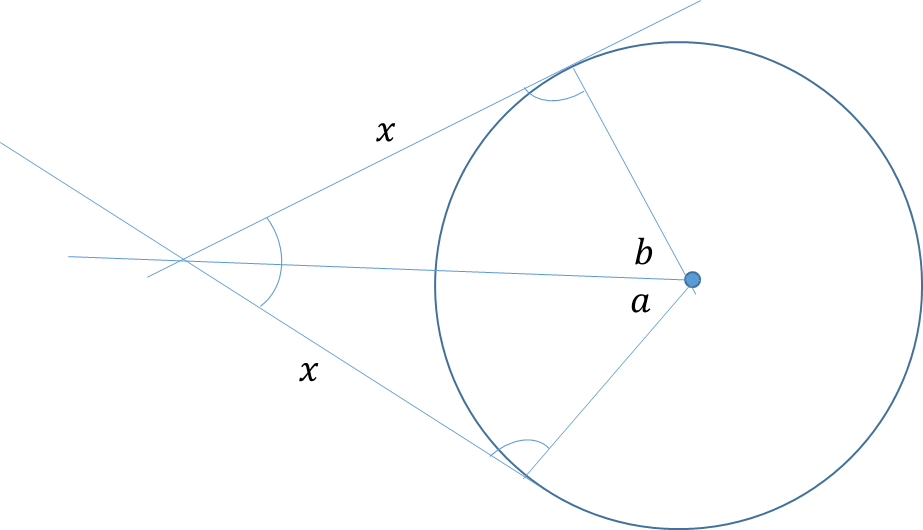
Theorem:
When two tangents touch a circle, they have equal lengths from their intersection point
Example: In the diagram, (RS) ̅ and (RT) ̅ are tangent to the circle with centre O. ∠TUS = 680, ∠SRT = x and ∠UTO = y. Find the value of x
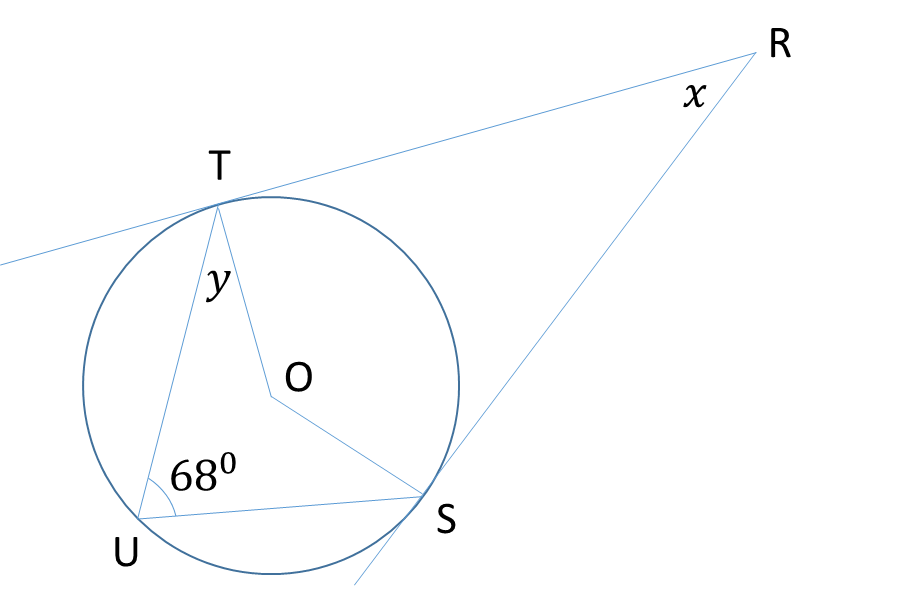
obtuse angle TOS = 2 × 680 = 1360
(∠ “subtended at centre” = 2 × ∠ “subtended at circumference” )
∠RTO = ∠RSO = 900
(∠ “tangent makes with radius at common point is ” 900 )
x = 360-90-90-136 (sum of ∠ in a quad.)
x = 440
Example: In the diagram is a circle MNPR with centre O. The angle at O is 1960 and ∠NMO = 560. Find the value of m.
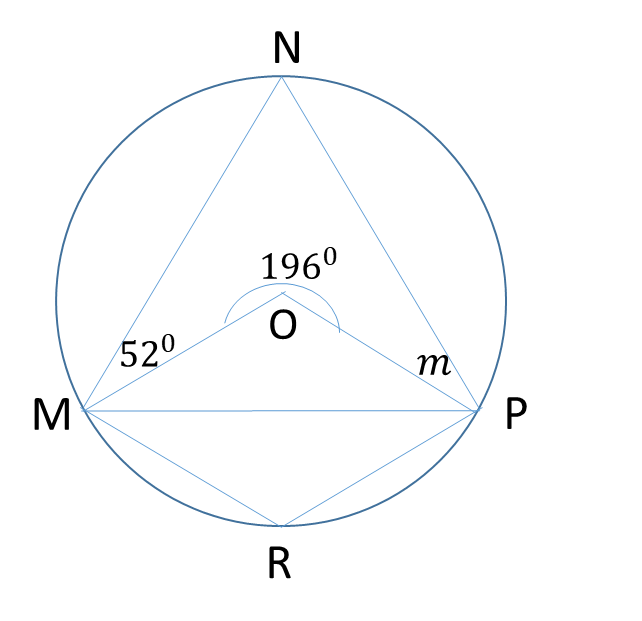
Obtuse angle MOP = 360-196 = 1640
∠MNP = 820 (∠ at centre=twice ∠ at circumference)
From quadrilateral MNPO, 52 + ∠MNP + m + 1960 = 3600
52 + 82 + m + 196 = 360
m + 330 = 360
m = 300
PRACTICE: PQ is a tangent to the curve RST at the point S. PRT is a straight line, ∠TPS = 340 and ∠TSQ = 650.
(i) Illustrate the information in a diagram
(ii) Find the value of ∠RTS and ∠SRP
GRAPHING
NOT AVAILABLE AT THE MOMENT
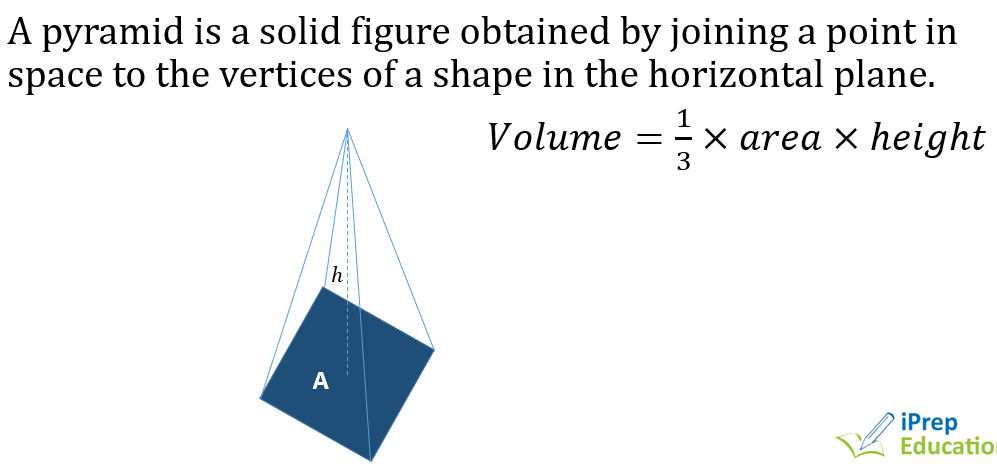
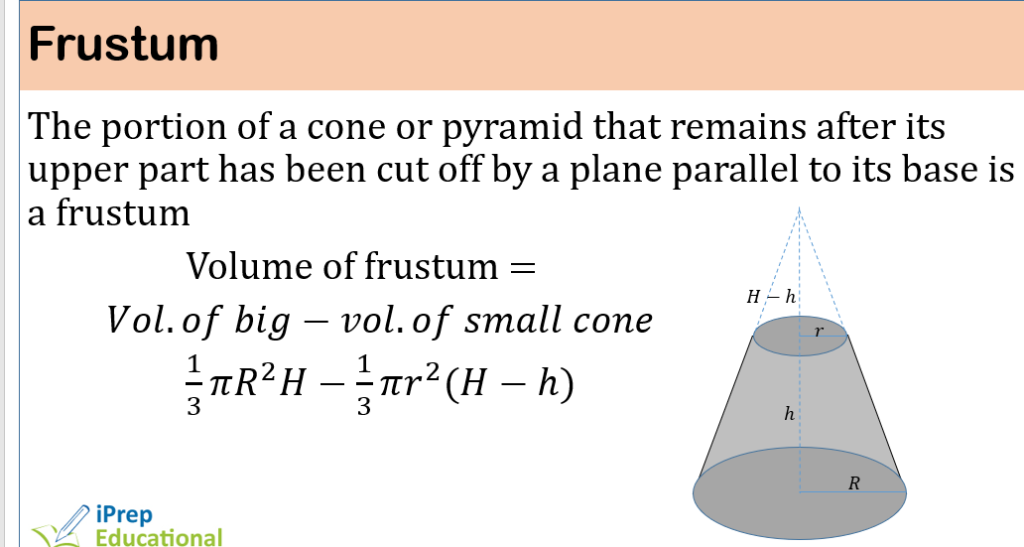
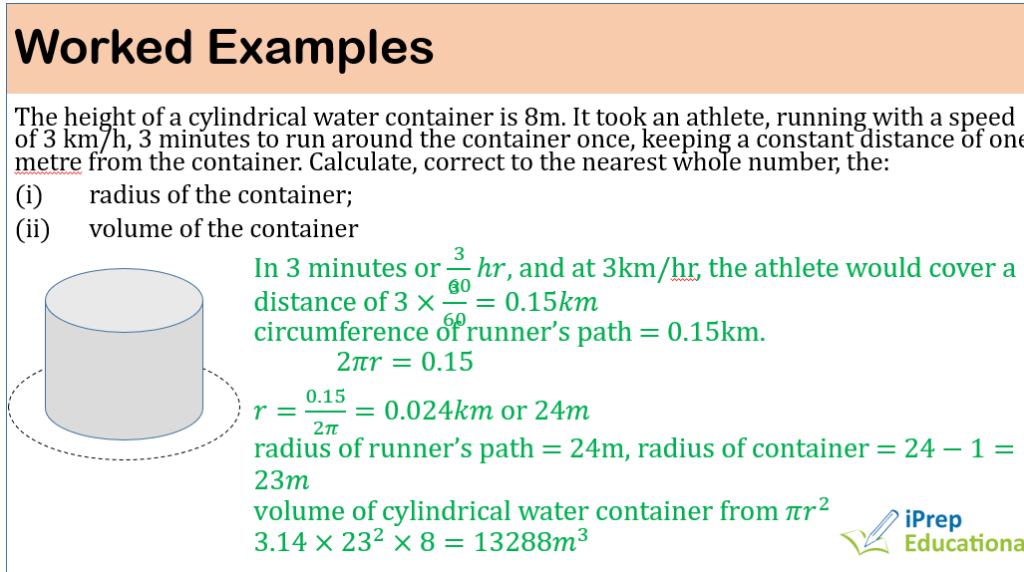
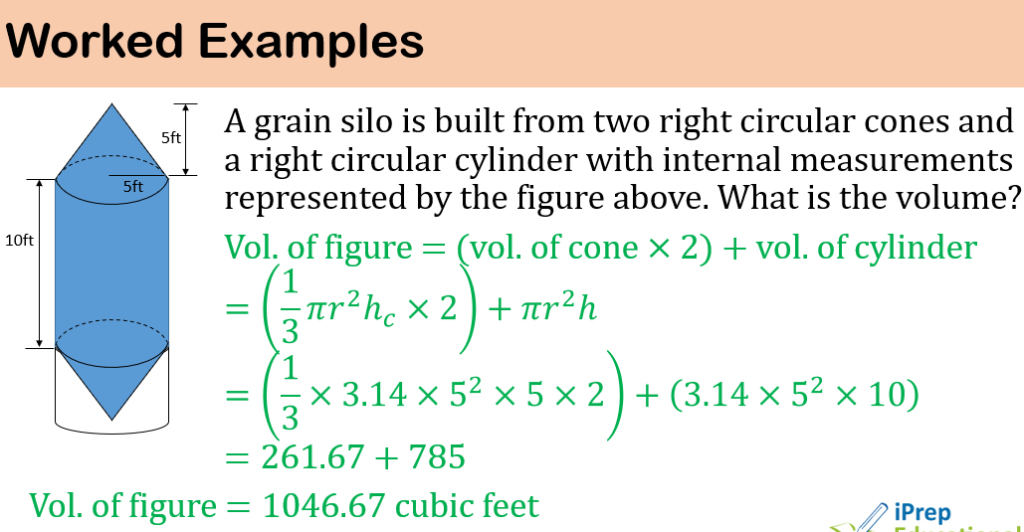
MESURATION


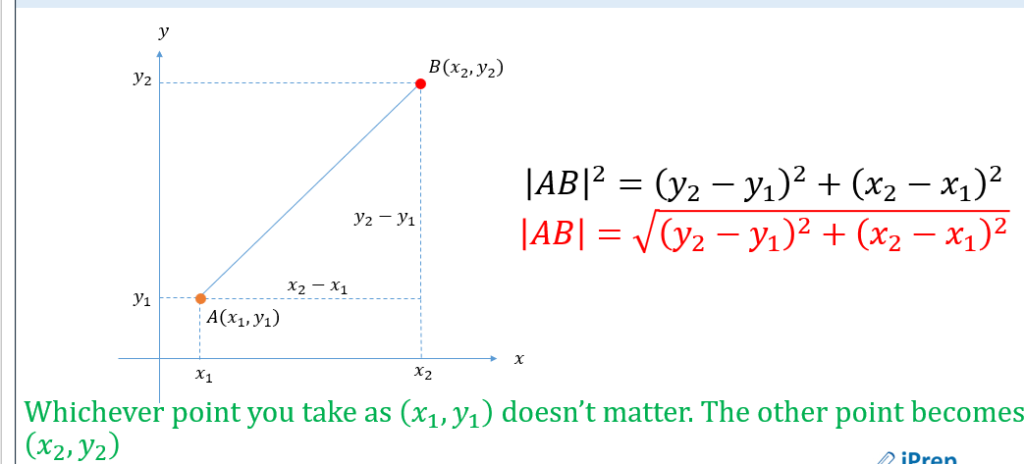
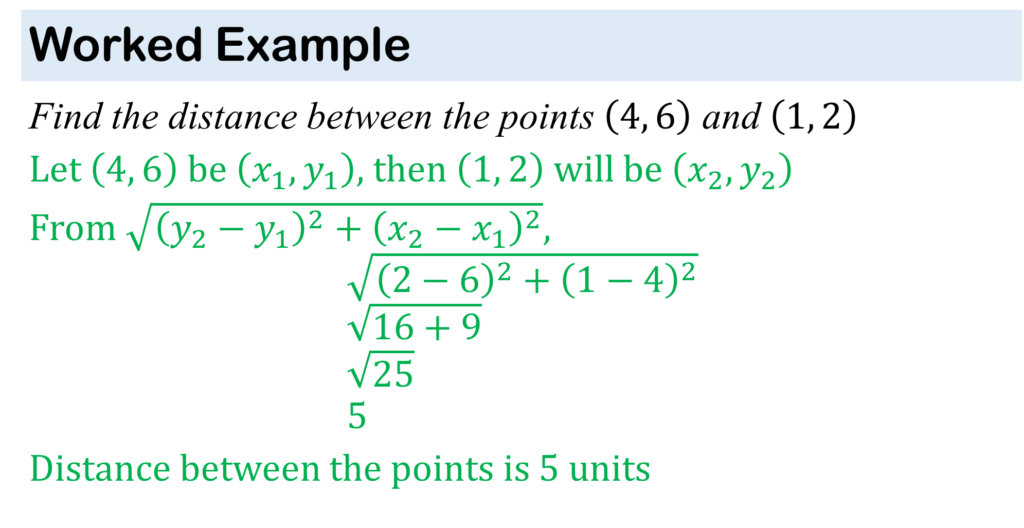
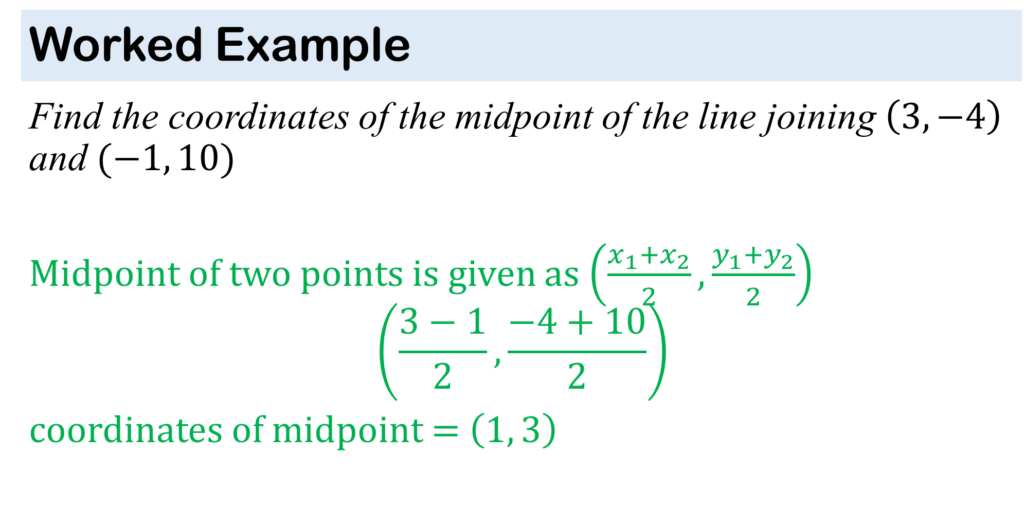
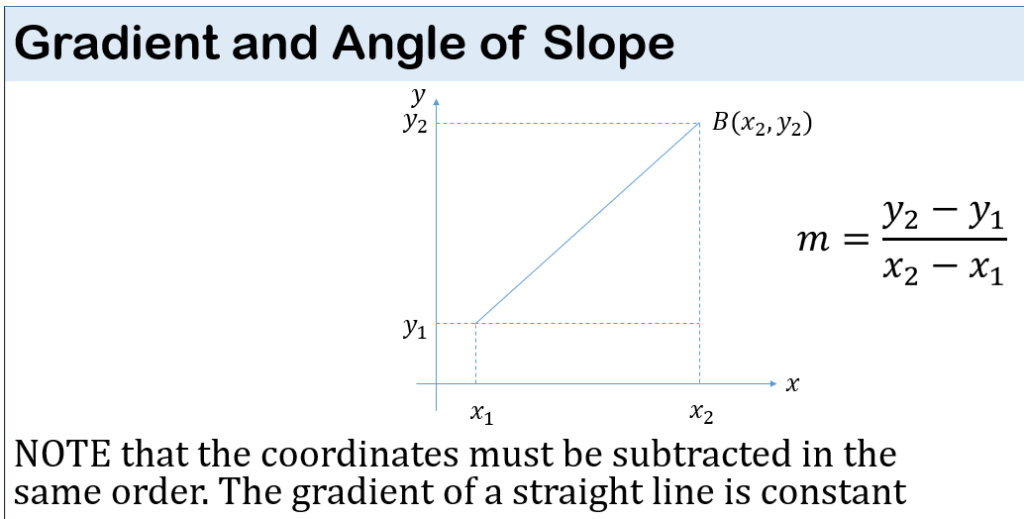
COORDINATE & TRANSFORMATION GEOMETRY


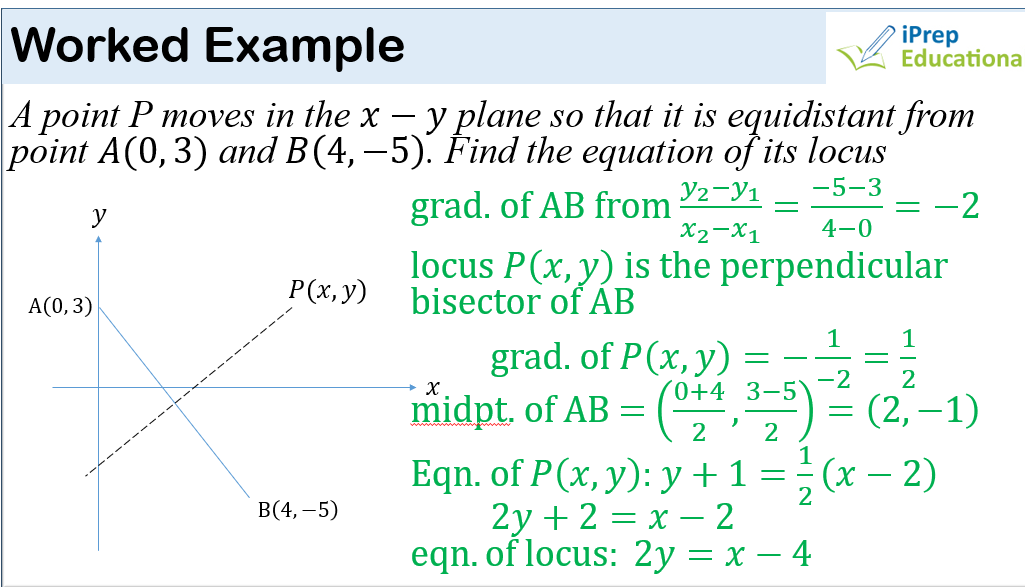
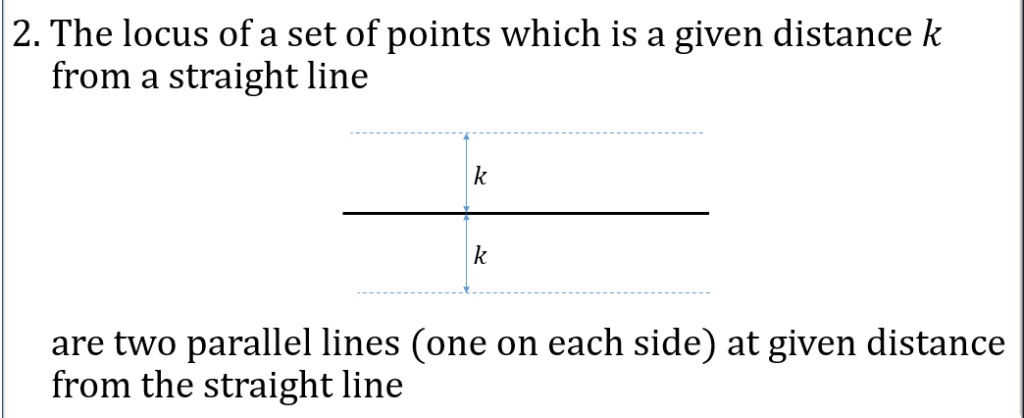
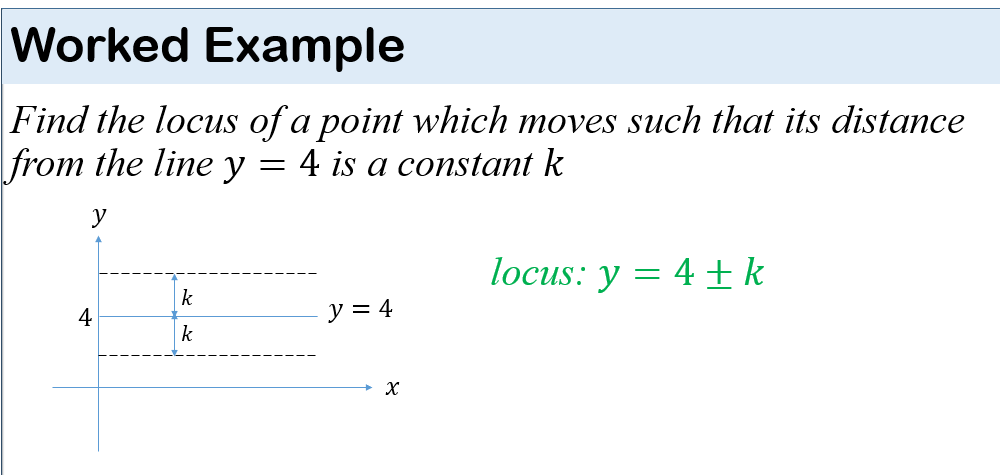
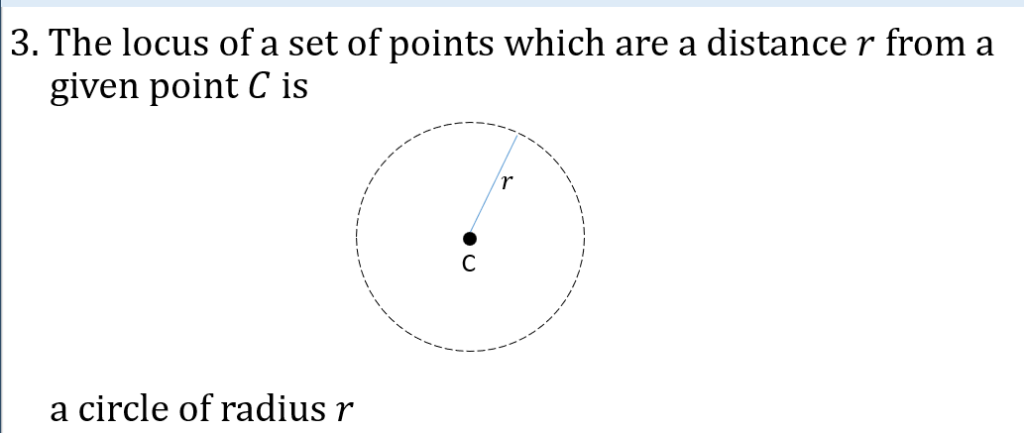
LOCI & CONSTRUCTION
NOT AVAILABLE AT THE MOMENT
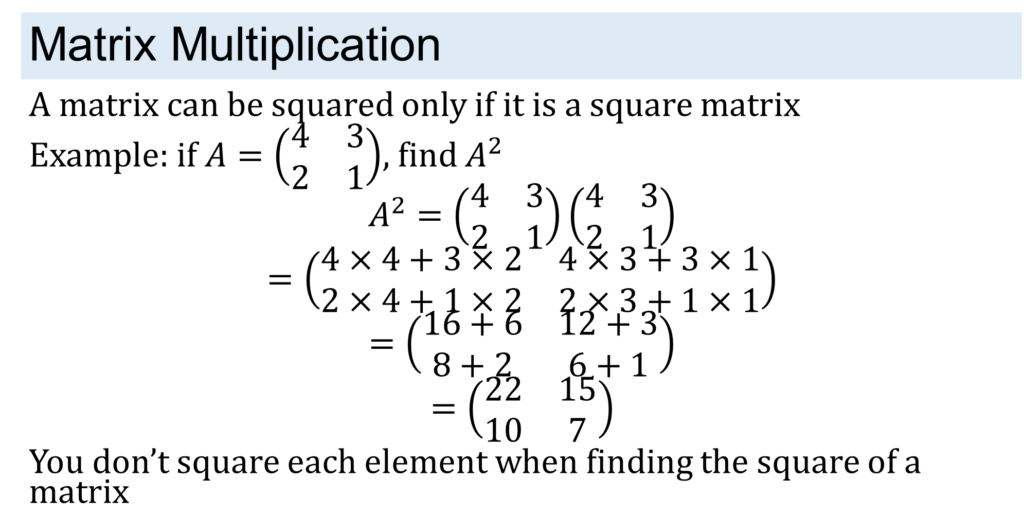
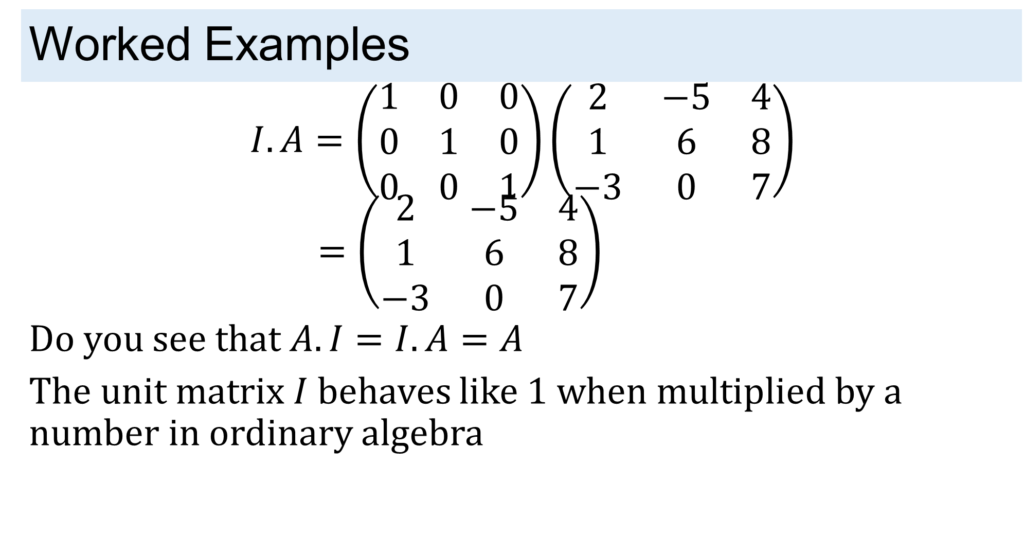
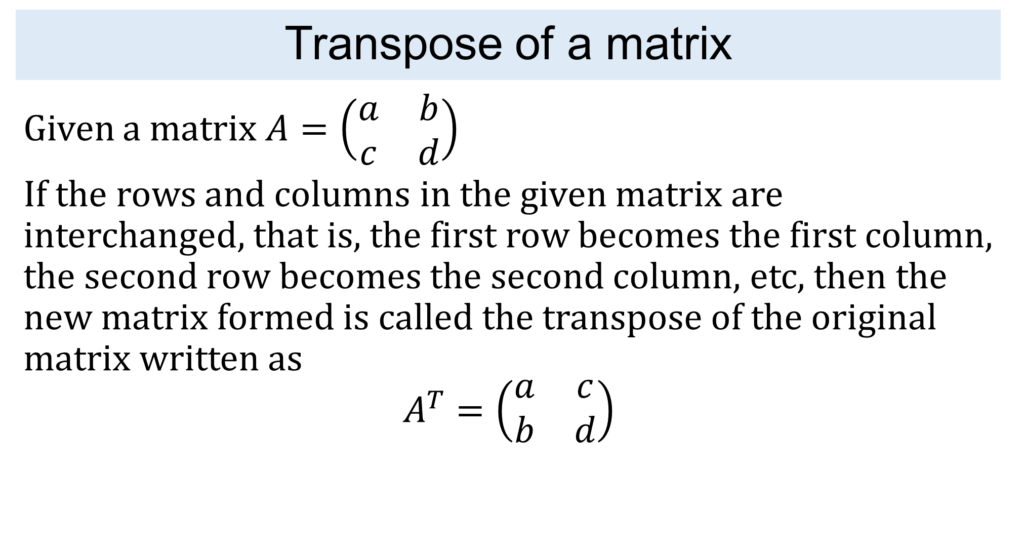
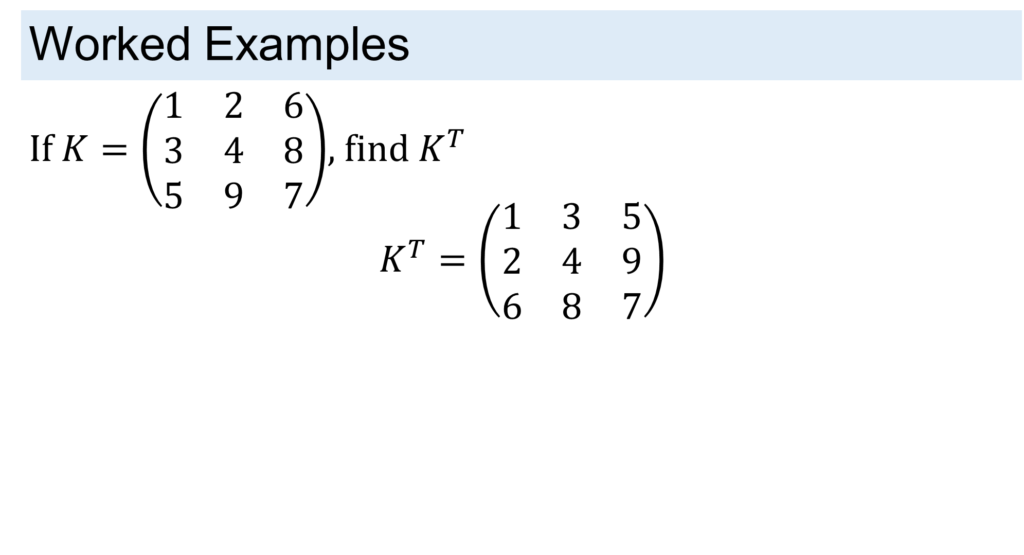
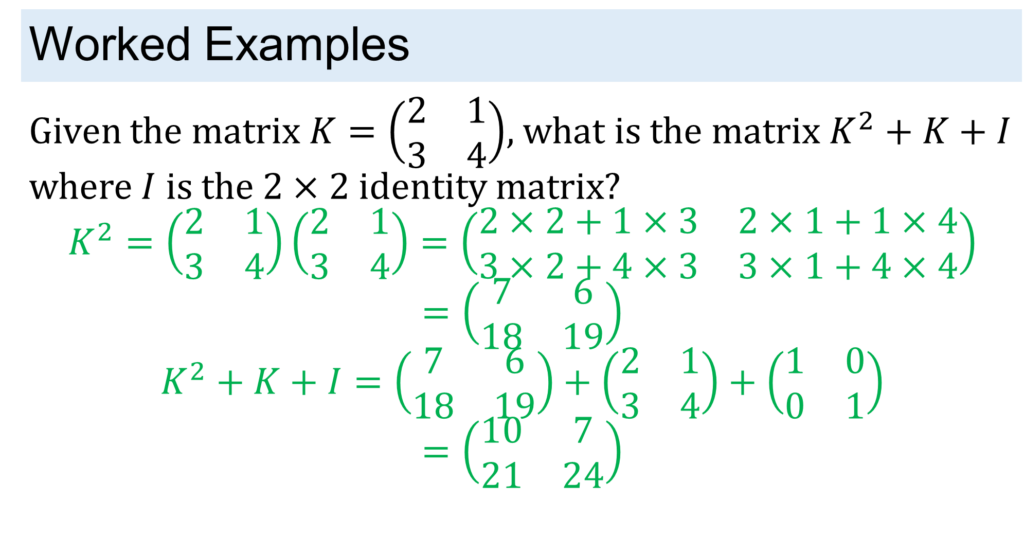
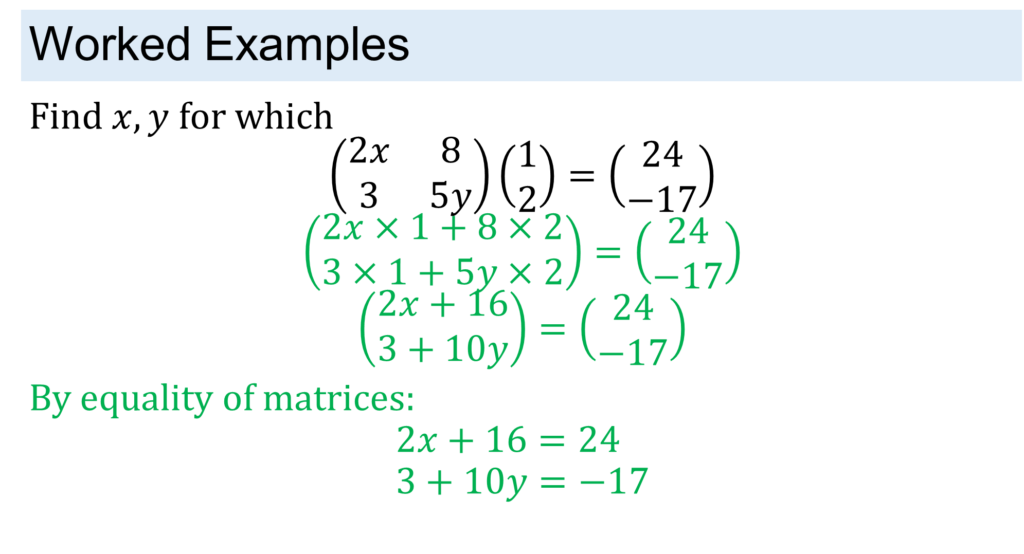
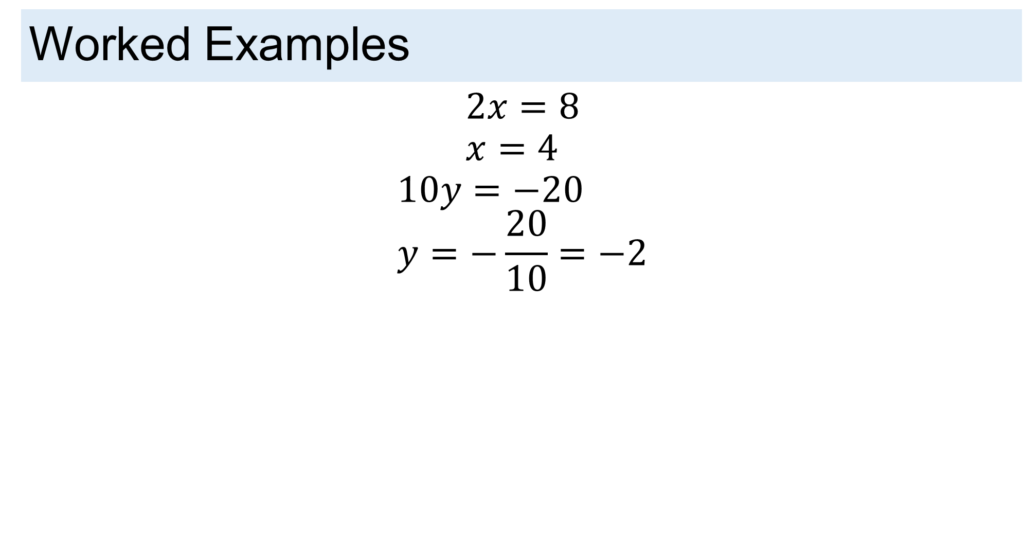
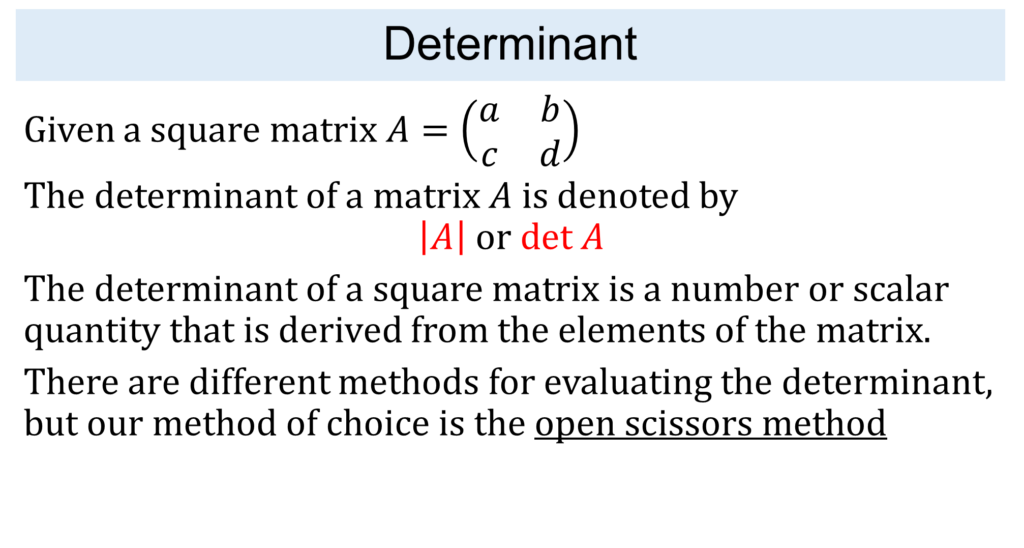
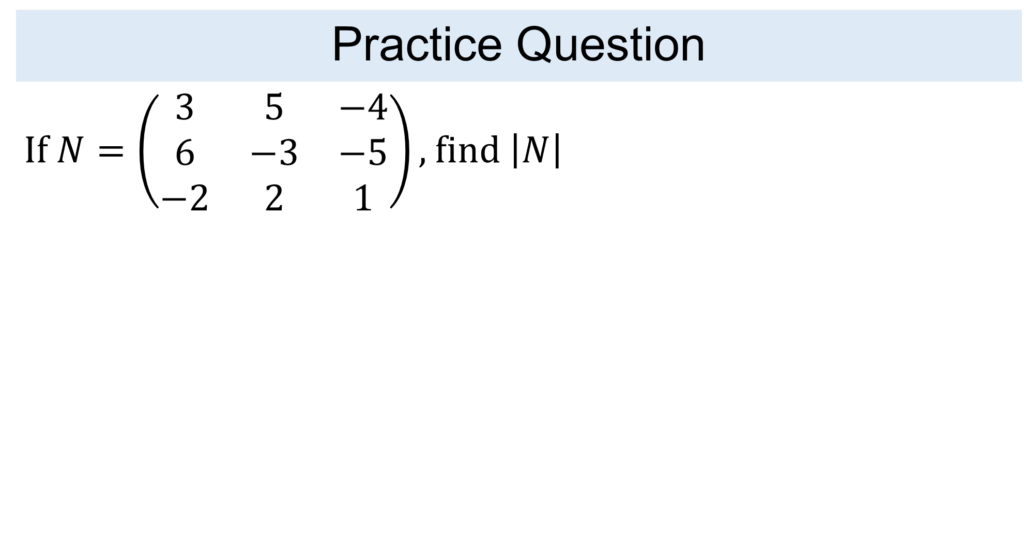
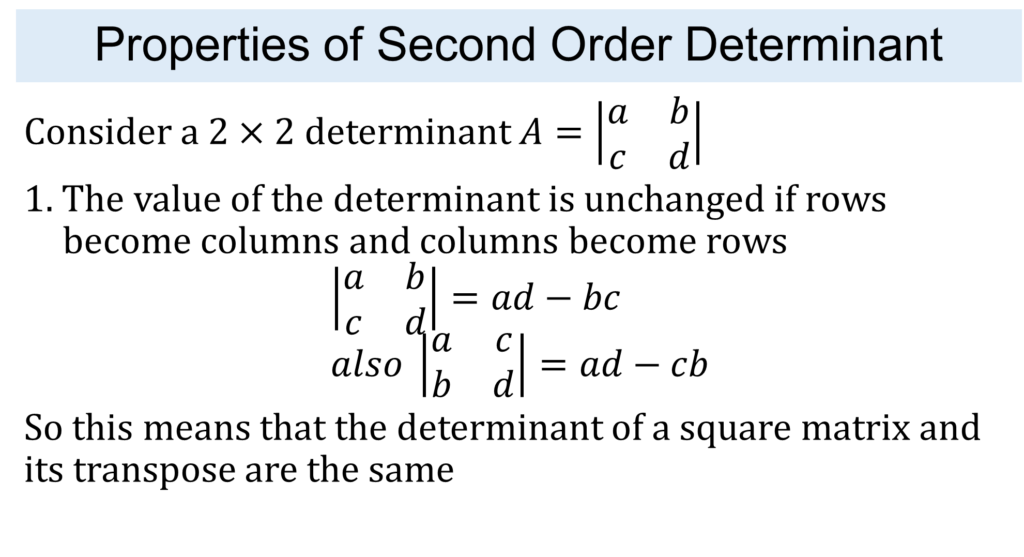
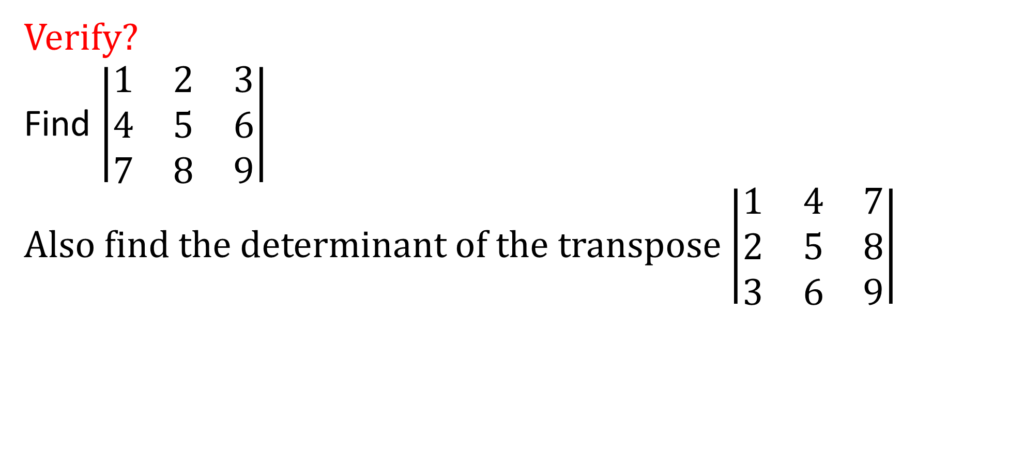
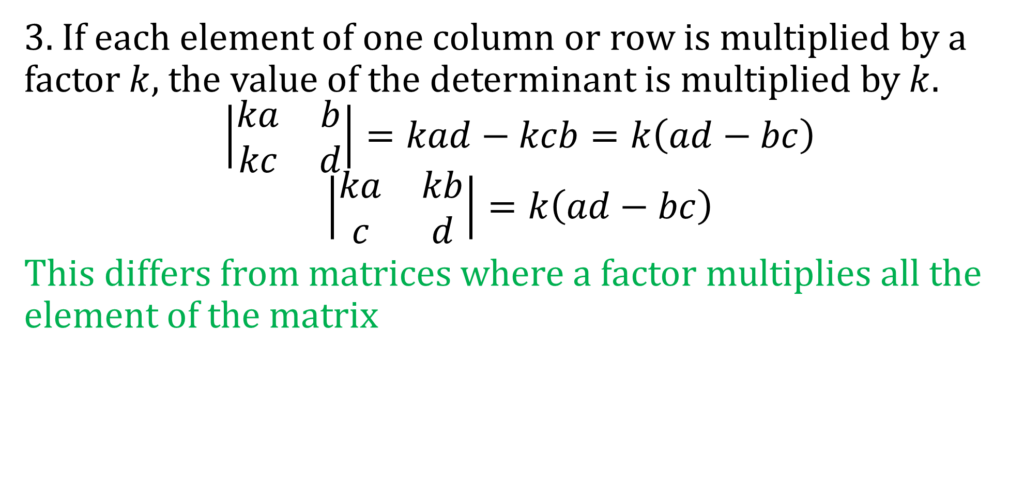
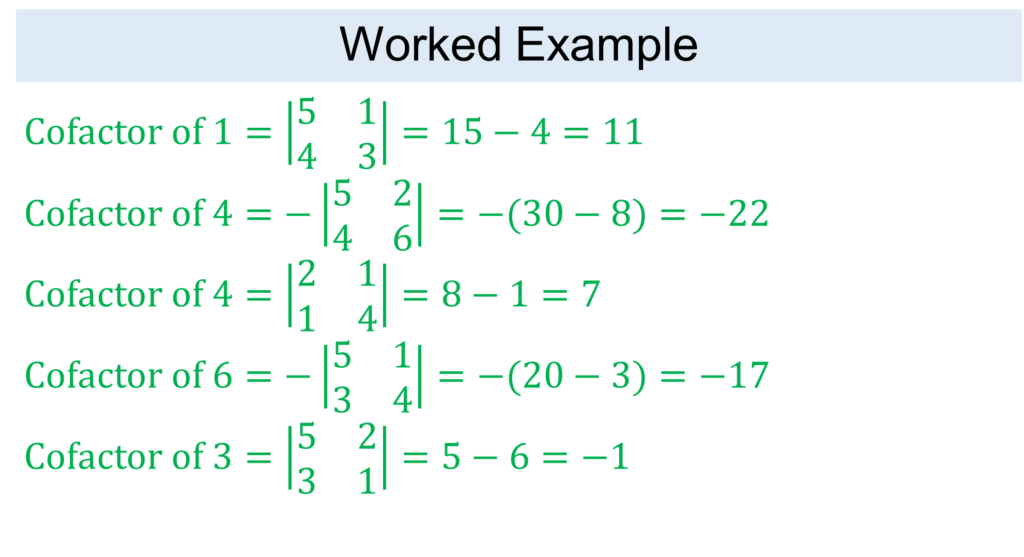
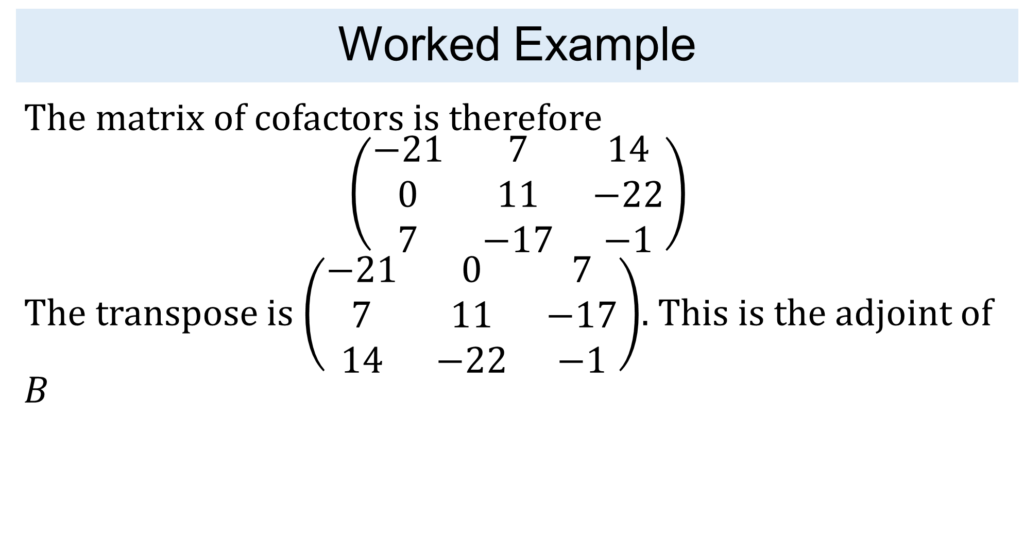
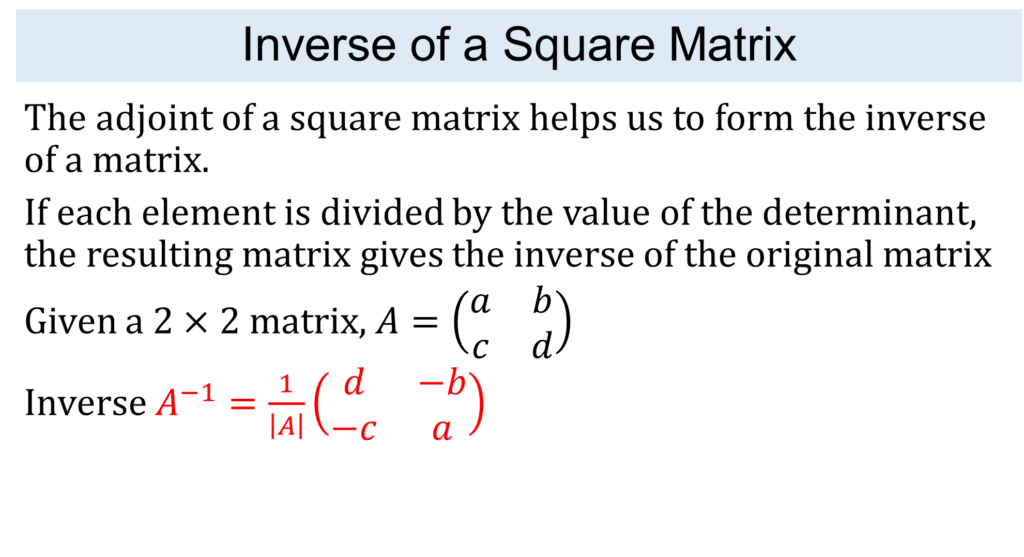
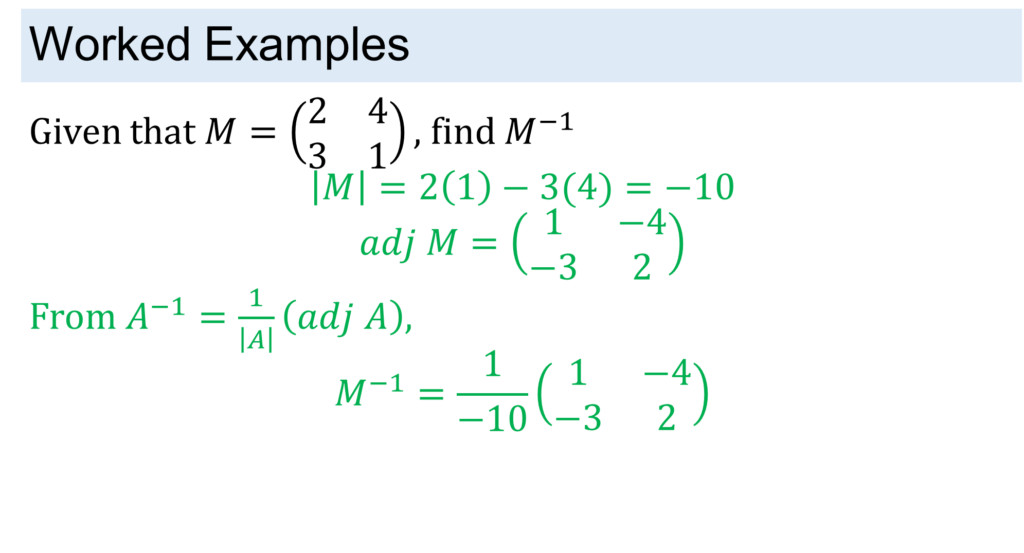
MATRICES & DETERMINANTS
Lorem ipsum dolor sit amet, consectetur adipiscing elit. Ut elit tellus, luctus nec ullamcorper mattis, pulvinar dapibus leo.


Matrix Representation and Notation
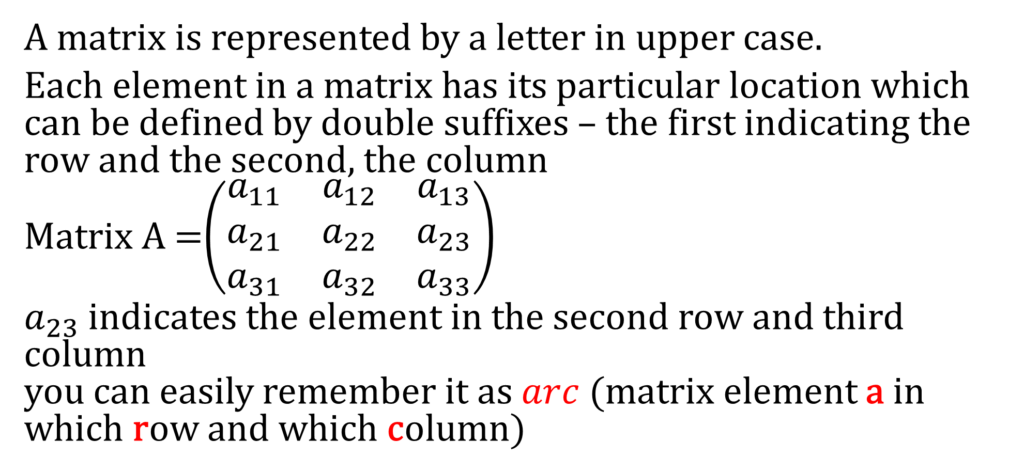
Matrix Representation and Notation

Types of Matrices


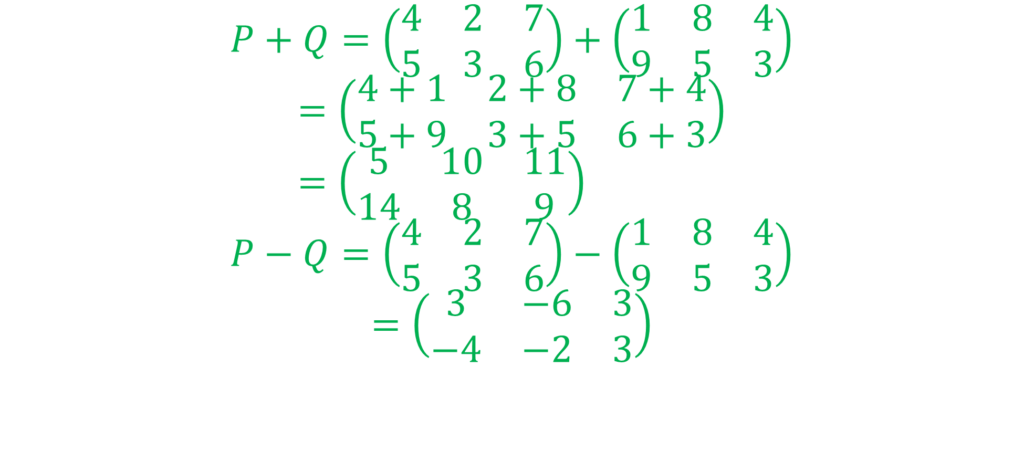
Addition and Subtraction of Matrices

Solution to Example
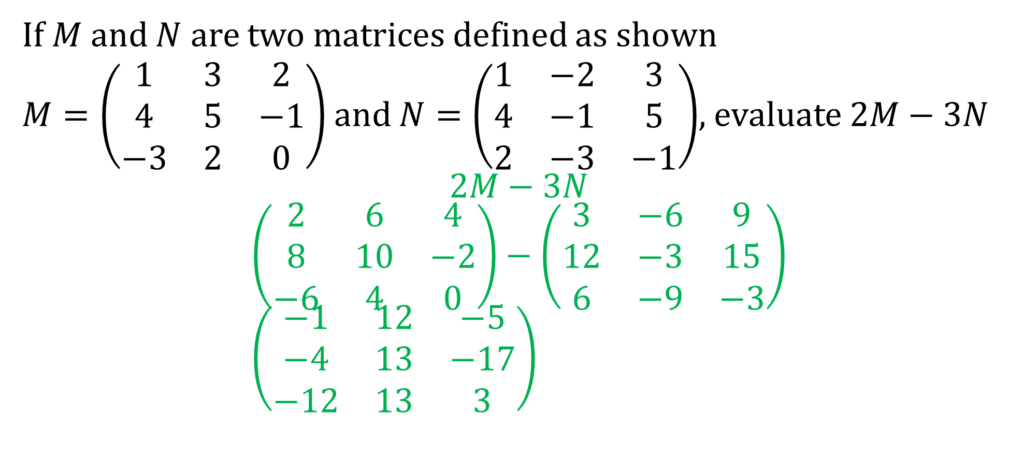
Scalar Multiplication


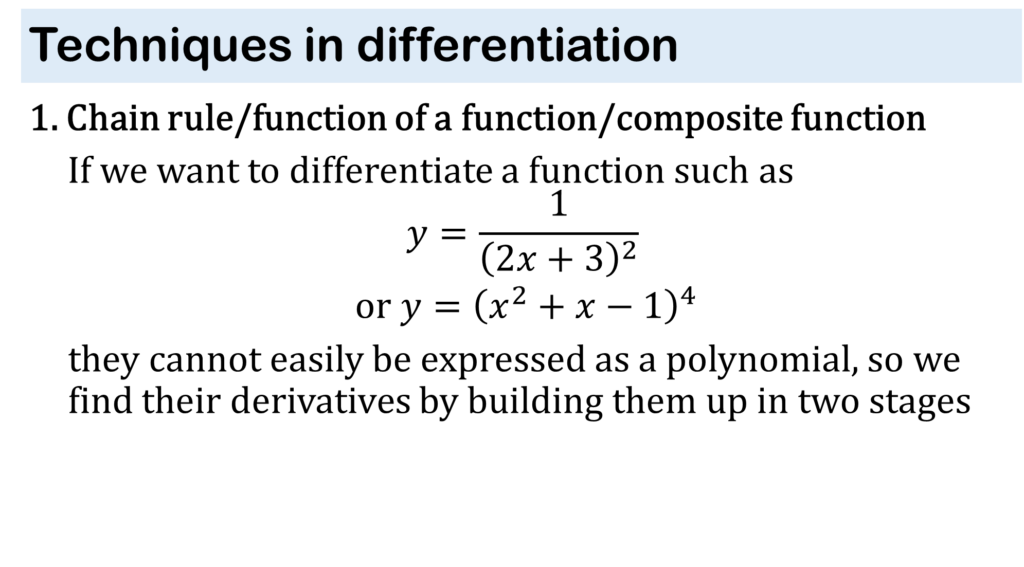
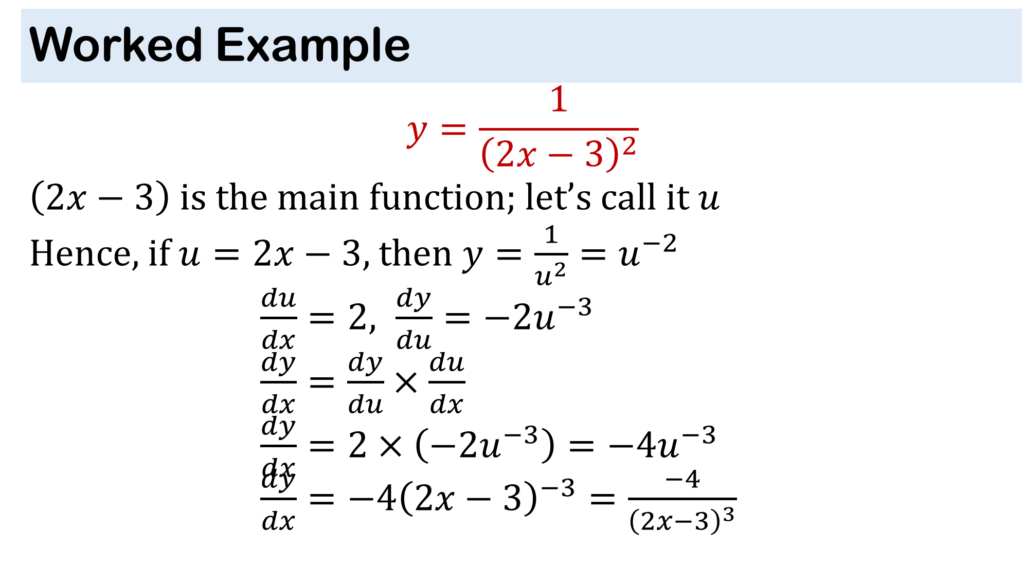
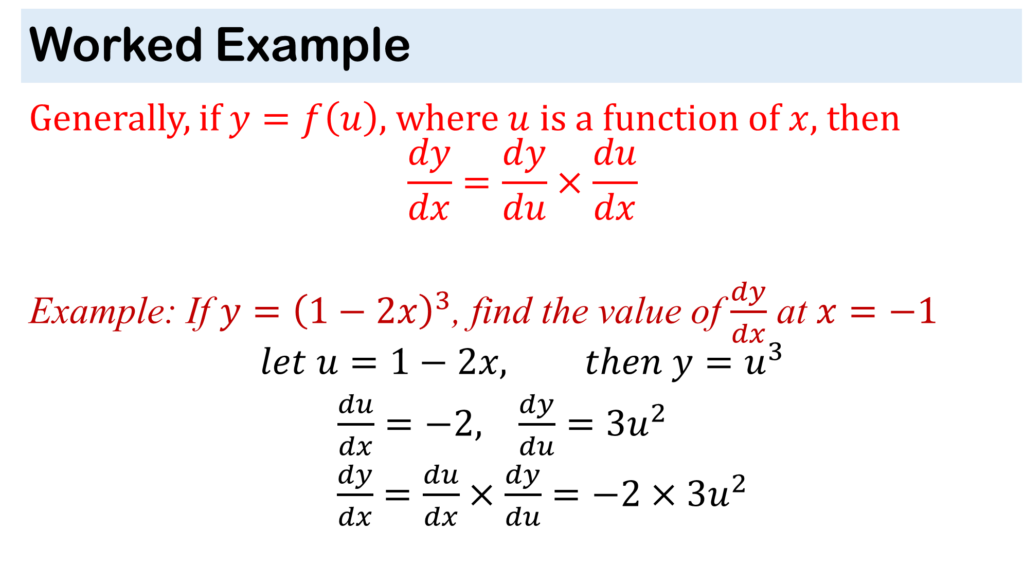
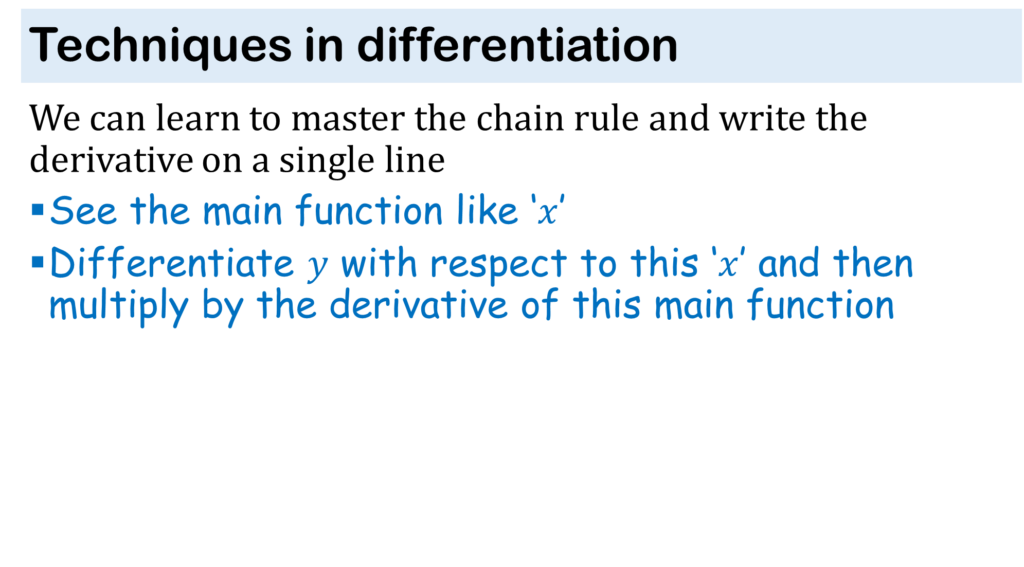
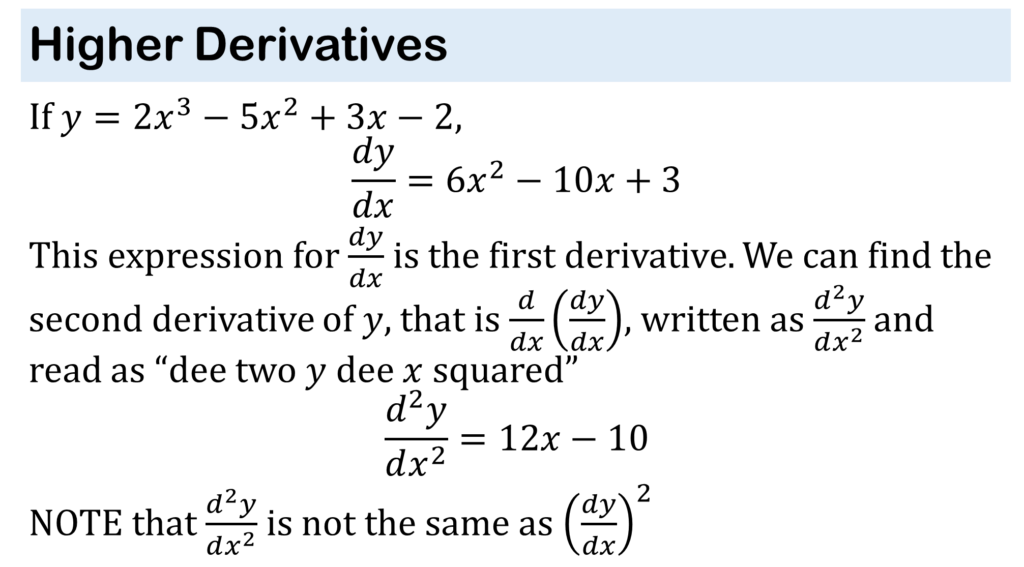
CALCILUS 1: DIFFRENCIATION


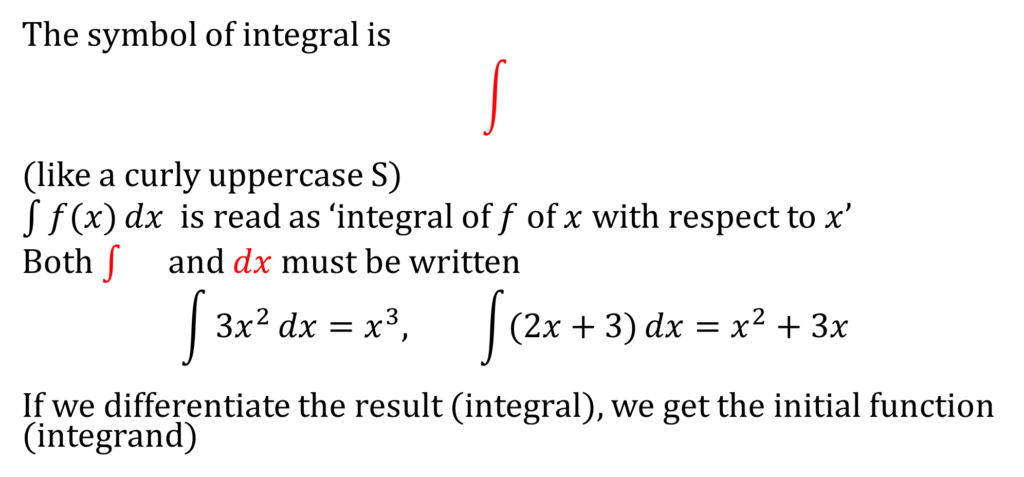
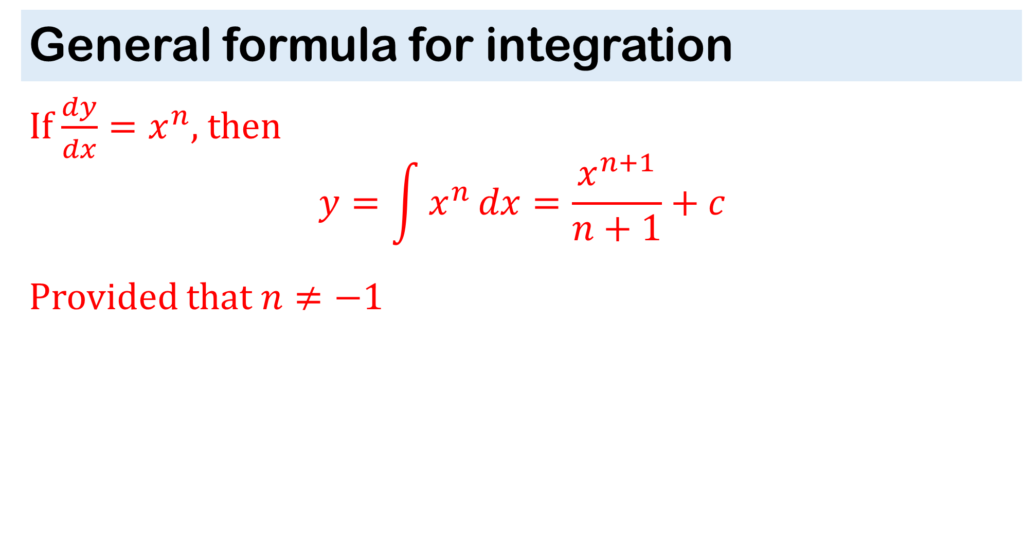
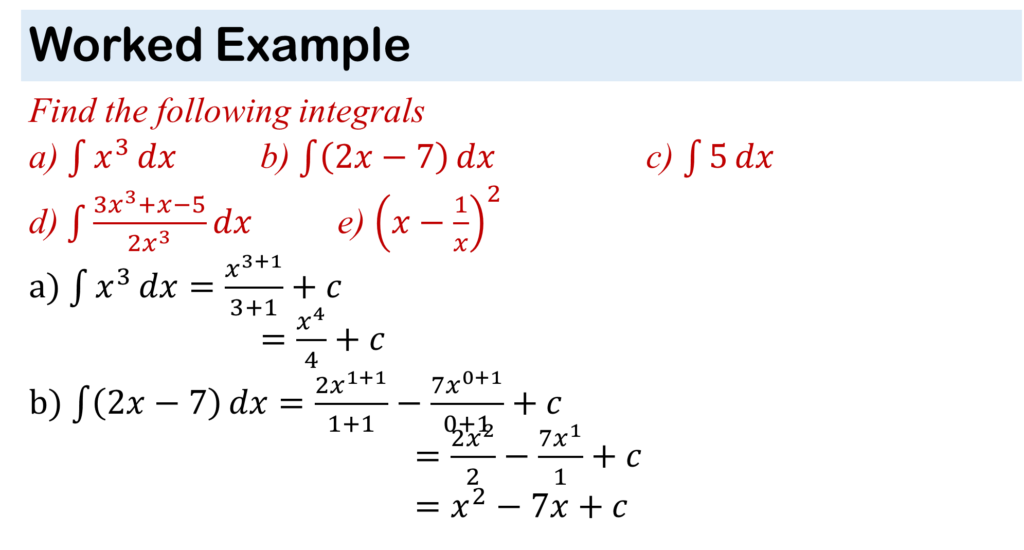
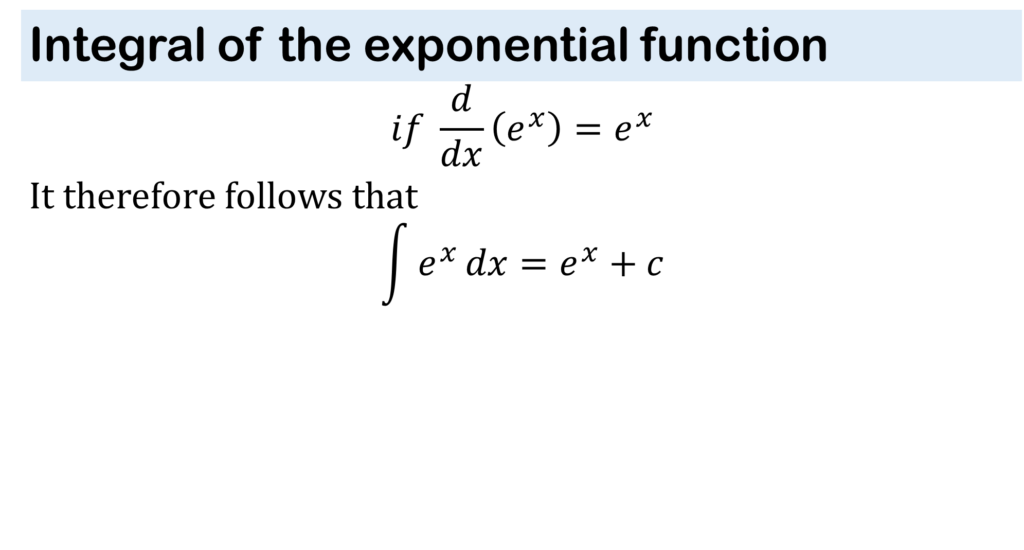
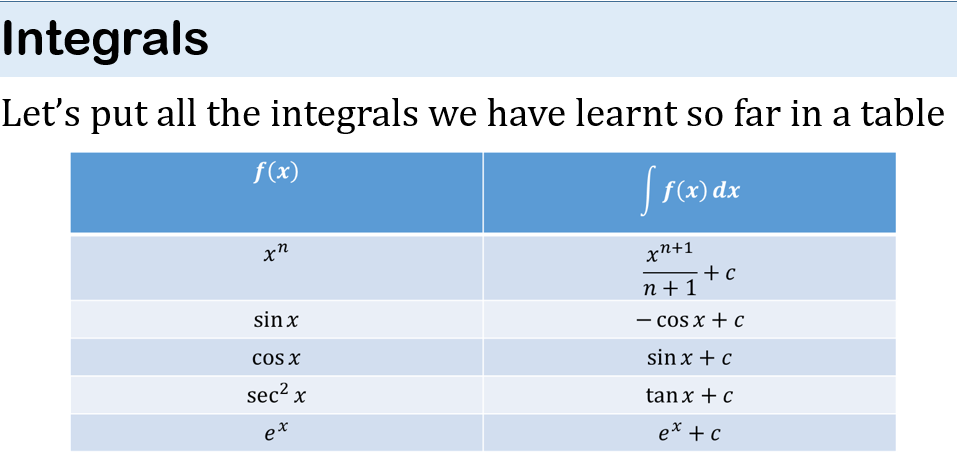
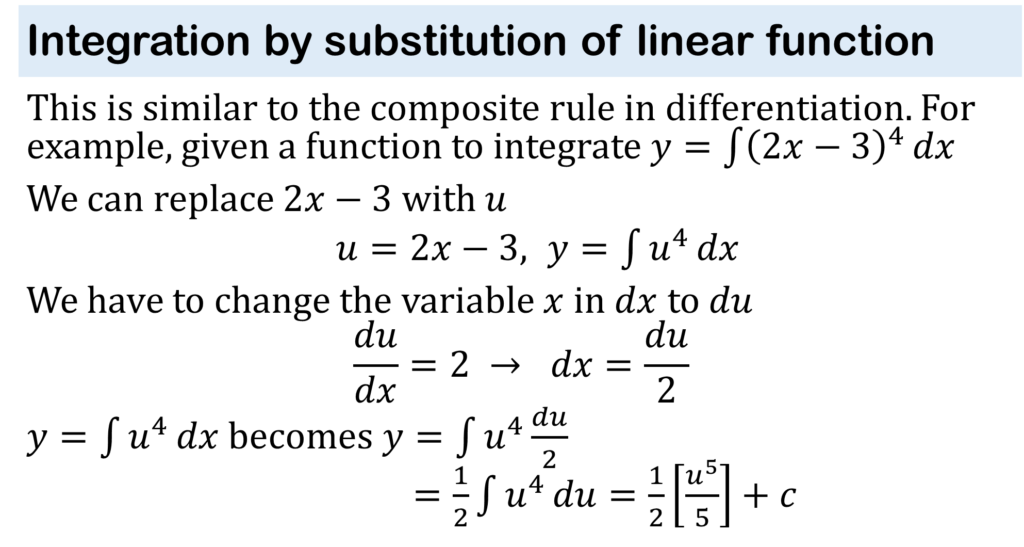
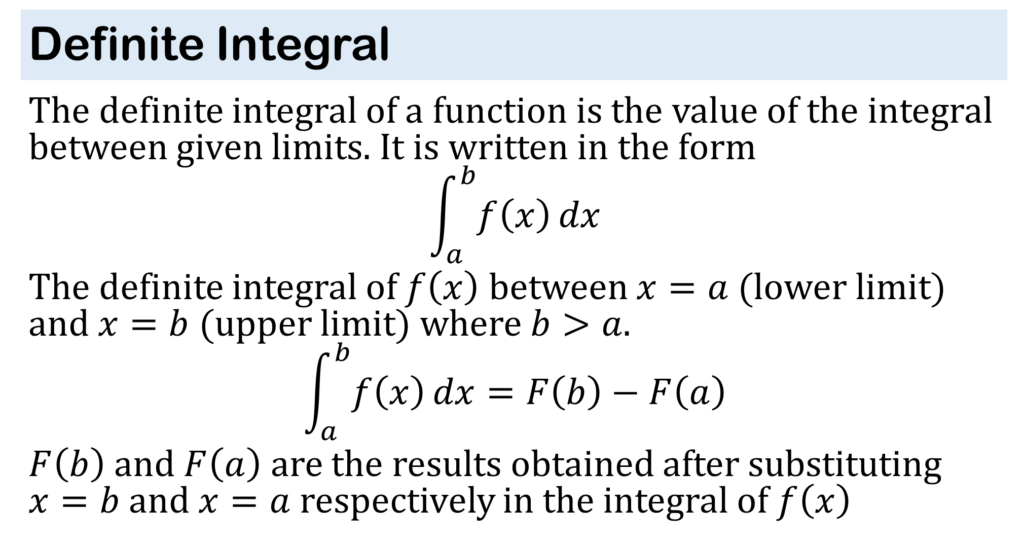
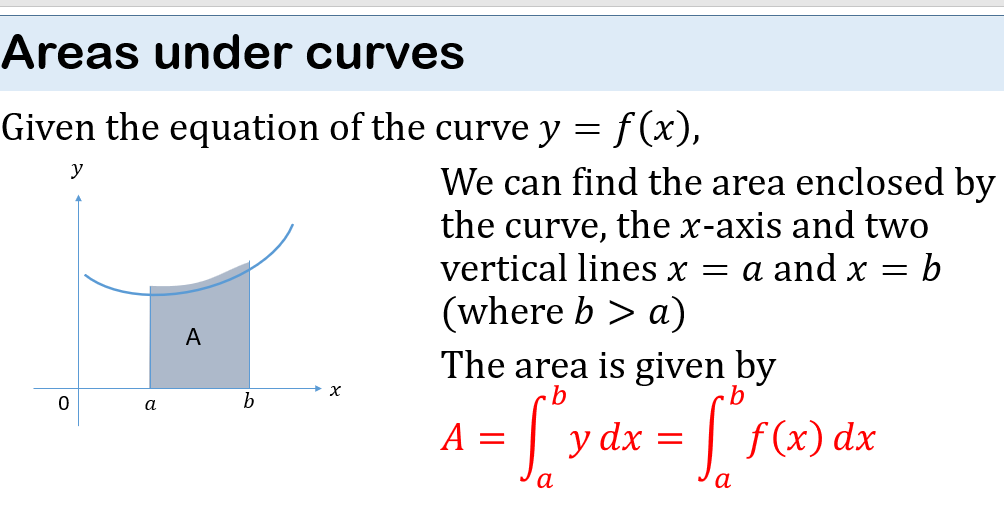
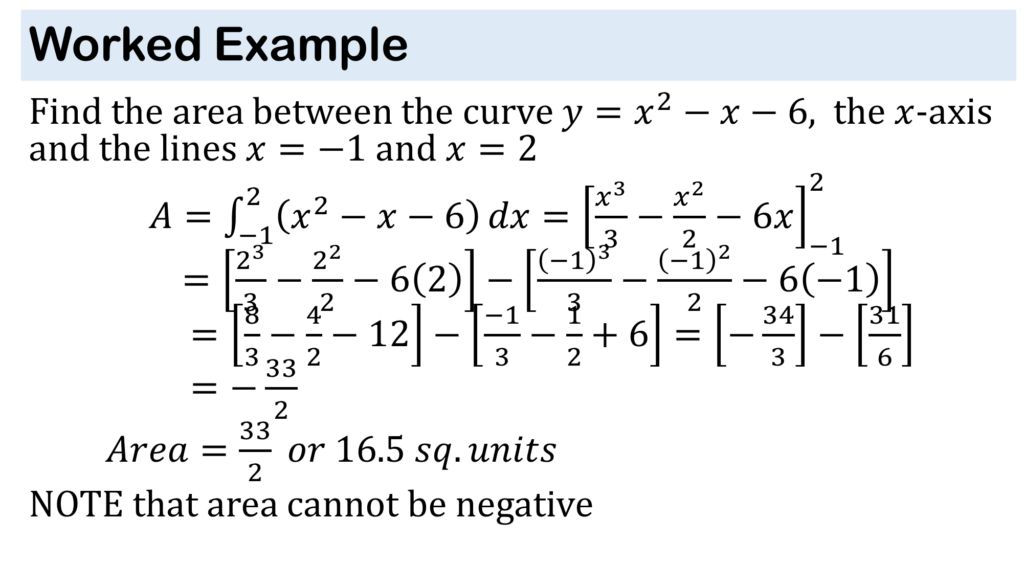
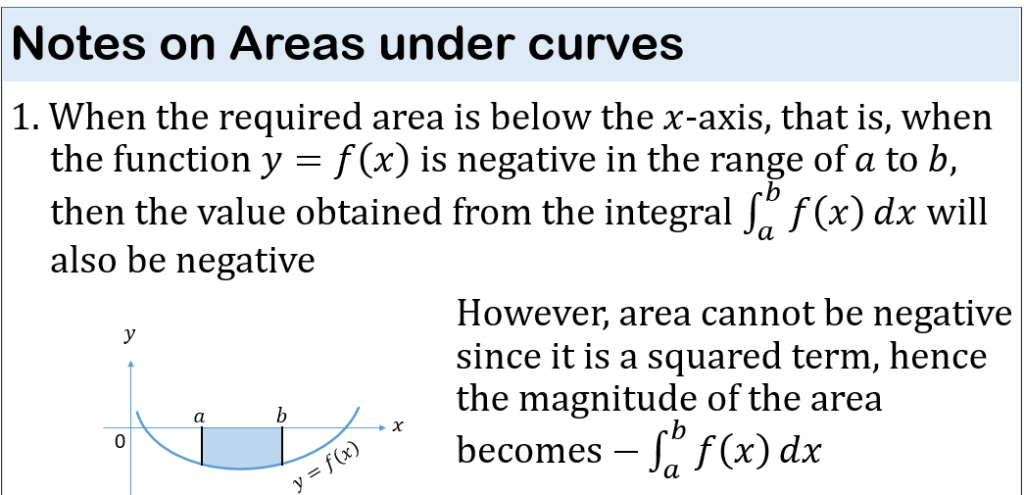
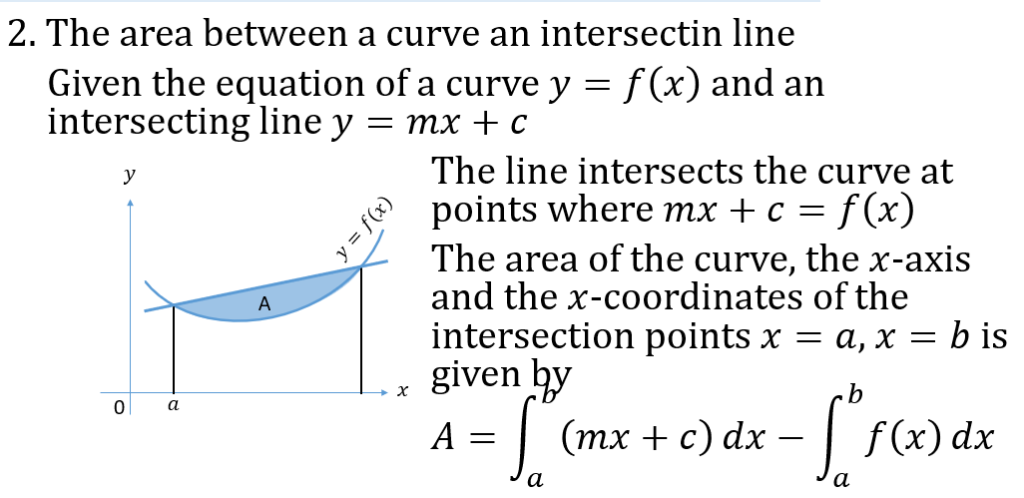
CALCULUS II: INTEGRATION


STATISTICS
Contents
•Introduction
•Representation of data
•Understanding grouped data
•Measures of central tendency
•Measures of dispersion
•Probability
•Mutually exclusive and independent events
•Probability distribution
Introduction
Statistics is an important branch of mathematics that deals with collection, analysis, presentation and representation of data.
Data (singular: datum) consist of sets of recorded observation or values from a survey, a test conducted, etc.
Accurate and well presented statistics helps in effective decision making.
Representation of Data
Data can be presented with the use of tables, charts and graphs.
Data Representation using Tables
Frequency tables are commonly used in presenting and summarizing data before analysis.
The frequency (f) is the number of times a particular value (x) in a given set of data
Consider the collection of the following data:
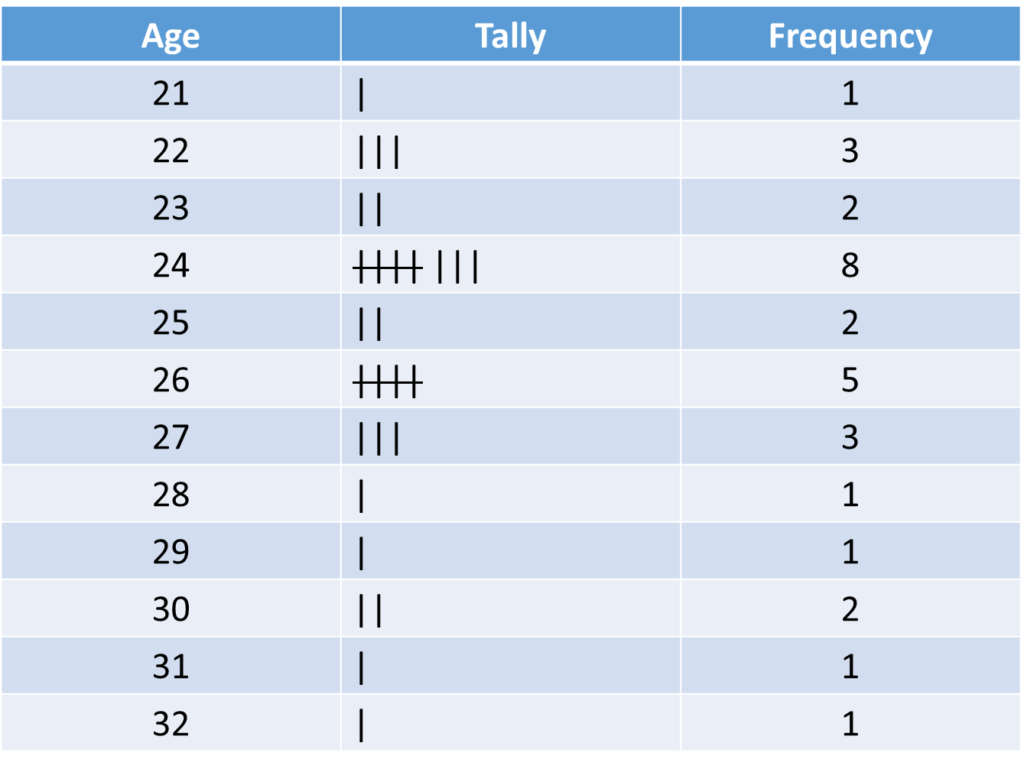
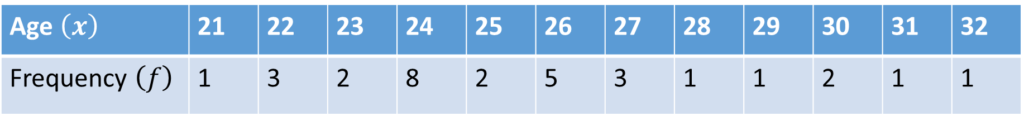
The ages of applicants for a particular job was collected and recorded;
24, 21, 26, 30, 27, 22, 32, 24, 26, 23, 24, 25, 24, 22, 31, 26, 25, 24, 27, 23, 29, 24, 22, 28, 26, 24, 24, 30, 26, 27
A tally diagram is a convenient way to record and obtain the frequency of each value in a set of data.
24, 21, 26, 30, 27, 22, 32, 24, 26, 23, 24, 25, 24, 22, 31, 26, 25, 24, 27, 23, 29, 24, 22, 28, 26, 24, 24, 30, 26, 27
Or it may be expressed in this way
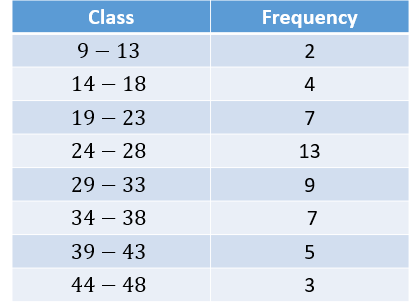
Grouped Data
If the range (difference between highest and least value) of data is large, it is more convenient to arrange them in groups or classes.
For example, the marks of students in a test conducted are as follows:
17, 28, 32, 23, 27, 47, 34, 38, 9, 20, 12, 25, 35, 29, 32, 15, 40, 34, 26, 21, 33, 34, 30, 42, 18, 28, 23, 40, 31, 28, 25, 19, 22, 37, 29, 32, 26, 28, 33, 23, 25, 24, 27, 34, 17, 42, 25, 22, 26, 46.
It appears there are too many marks, and the range is quite large. A grouped frequency table should be used
A class of marks may be 21-30 or 21-25.
21 and 30 (or 21 and 25) are called class limits.
The class 21-30 has a class interval of 10 marks (21 and 30 inclusive), while class 21-25 has a class interval of 5.
In arranging the classes (especially when not given), we should avoid having too many classes with a small class interval or having too few classes with a large class interval.
Ideally, the number of classes should be between 6 and 12.
Let us choose the class has an interval of 5
17, 28, 32, 23, 27, 47, 34, 38, 9, 20, 12, 25, 35, 29, 32, 15, 40, 34, 26, 21, 33, 34, 30, 42, 18, 28, 23, 40, 31, 28, 25, 19, 22, 37, 29, 32, 26, 28, 33, 23, 25, 24, 27, 34, 17, 42, 25, 22, 26, 46.
Representation of Data Using Charts
Data can also be presented using two basic types of charts: bar chart and pie chart.
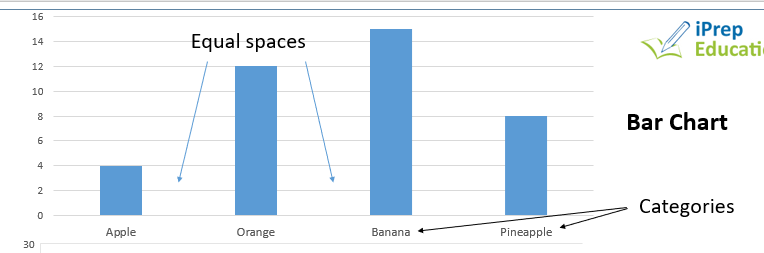
Bar Charts
A bar chart is a statistical graph that consists of rectangles or bars all having the same width but whose height are proportional to the frequencies of the variables given.
The rectangles are usually drawn separately and equal spaces exist between each rectangle.
Worked Example
The number of graduates with first class degrees in a certain institution from 2005 to 2010 is given in the table below.
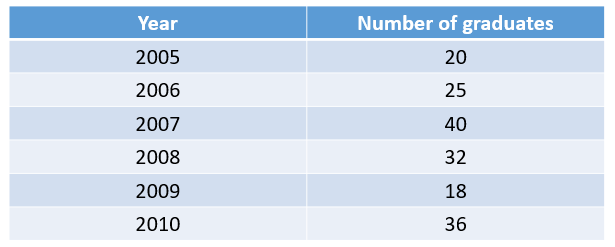
Represent the following information in a bar chart

Pie Chart
A pie chart is a circular graph where each item is represented by a sector of a circle. The angle of each sector is proportional to the corresponding frequency item.
When drawing a pie chart,
•find the total frequency ∑f and equate to 3600
•find the corresponding angle of each item using the frequency fi as in fi/(∑f)× 3600
•use a pair of compasses and pencil to draw a circle big enough to conveniently represent small angles
•use a protractor to measure the angle of the sector corresponding to each item
Worked Example
The grades of 36 students in a test are shown in the pie chart. How many students had “excellent”.
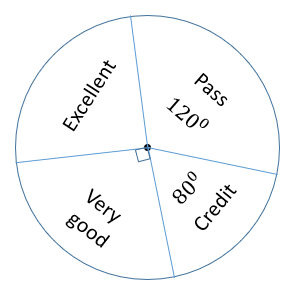
Let the angle for “excellent” be e
e+120+80+90=360
e+290=3600
e=700
The number with “excellent” is
70/360×36=7 students
Worked Example
In a tutorial class, the lesson periods for each week are itemized as shown: English 10, Mathematics 7, Biology 3, Economics 4, Physics 3, others 9. Draw a pie chart to illustrate this information
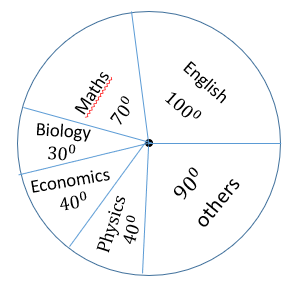
Total = 10+7+3+4+3+9=36
English: 10/36×360=1000
Mathematics: 7/36×360=700
Biology: 3/36×360=300
Economics: 4/36×360=400
Physics: 3/36×360=300
Others 9/36×360=900
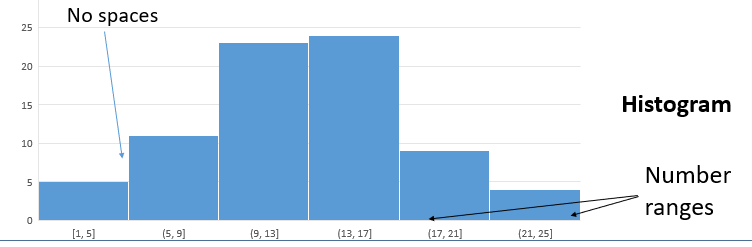
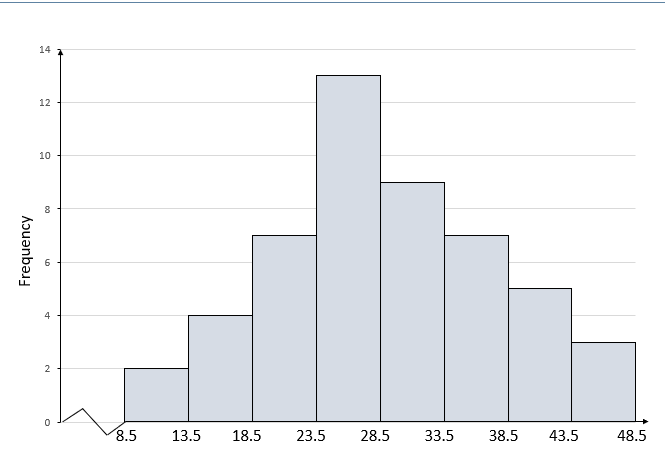
Histogram
A histogram is similar to a bar chart. It is also a graphical representation of data that consist of rectangles but two major differences exist between histograms and bar charts.
1.There are no spaces in between the rectangular bars unless frequency is zero
2.The width of each rectangle corresponds to the class width for grouped data.
If however the grouped data has equal class interval, then the width of each rectangle will be the same but the height will depend on the frequency (as with bar chart).
In general, the area of each rectangle in a histogram is proportional to the class frequency
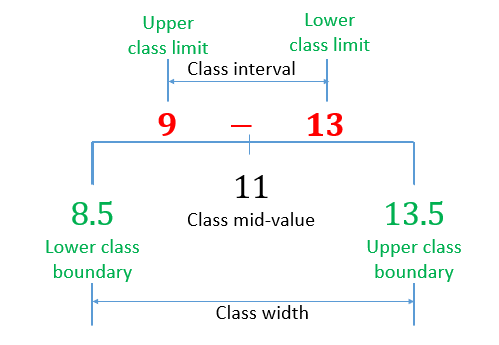
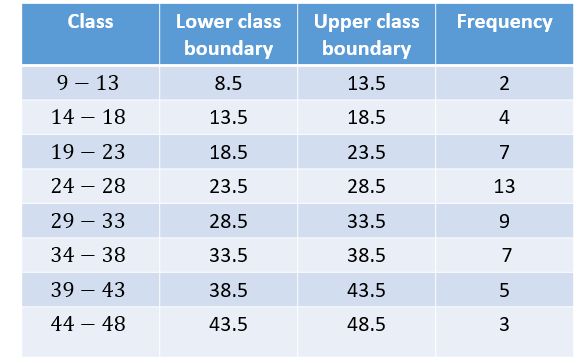
Understanding Grouped Data: Class boundaries
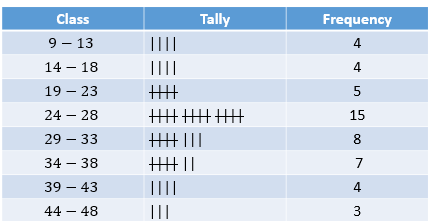
In the group frequency table shown earlier, we saw classes such as 9-13, 14-18, etc.
9 and 13 (or 14 and 18) are called class limits.
9 is the lower class limit for the class 9-13 and 13 is the upper class limit.
Between the upper class limit, 13 and the lower class limit of the next class, 14, there is a space of 1 unit (14-13=1). In theory, the class interval 9-13 includes all scores from 8.5 to 13.5. These end points 8.5 and 13.5 are called class boundaries. 8.5 is the lower class boundary and 12.5 is the upper class boundary for the class 9-13.
The difference between the upper class boundary and the lower class boundary is the class width.
For the class interval 9-13, the class width is 13.5-8.5=5. This is the same for all intervals
If all the classes in a given distribution have equal class width, then the distribution is uniform.
Class mid-value or central value: This is the midpoint of the class interval. It is half of the sum of the upper and lower class limit. Central value of class 9-13 is 1/2 (9+13)=11
Worked Example
Represent the following grouped frequency table on a histogram
Putting the terms defined in a table
Frequency Polygon: This is a line graph obtained from the frequency distribution
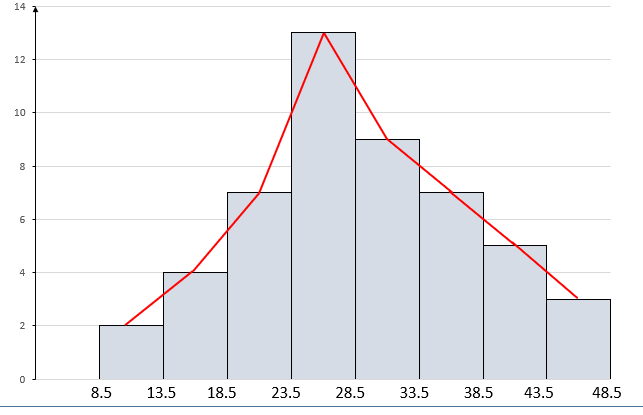
Deductions from the histogram
1. Modal class: the class interval with the greatest frequency is the modal class. This is the class with the tallest rectangle
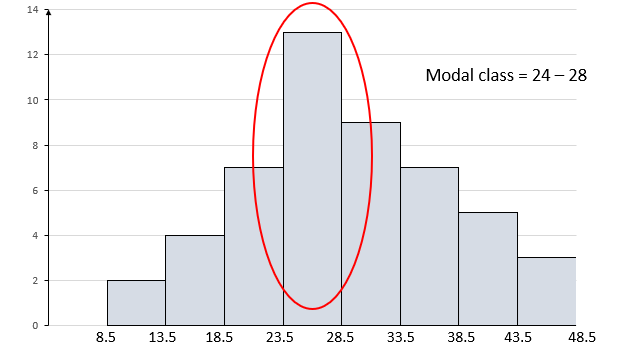
2. Mode: this is obtained by drawing lines joining the vertices of the modal rectangle with the vertices of the adjacent rectangles (left & right). Then trace down the mode from the intersection of the lines

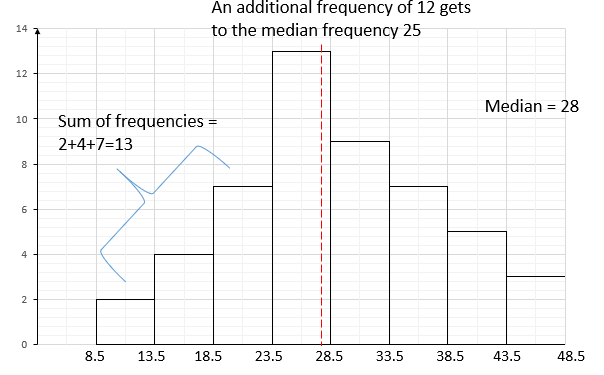
3. Median class: this is the class that contains or corresponds to half the total frequency. Total frequency = 50, half = 25
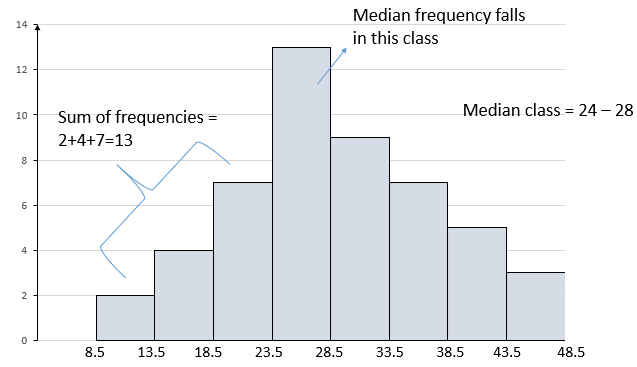
4. Median: this is the score that divides the histogram into two equal parts.
Practice
Toothpicks sold in boxes have printed on them by the manufacturer “Average contents: 48 toothpicks”. 100 boxes were picked at random and their contents were counted. The results are shown in the table
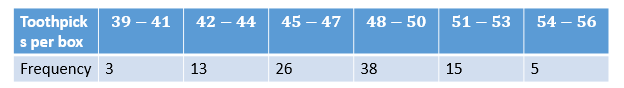
1.Draw a histogram of the distribution
2.By considering the modal class, mode and mean of the data, determine whether or not the statement made by the manufacturer is true
Measures of Central Tendency: mean, median & mode
Mean
It is also called average.
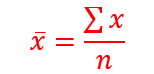
Given a set of values, the mean is the sum of all values divided by the number of values. If we have a set of n-numbers, x1, x2, x3, x4,..xn
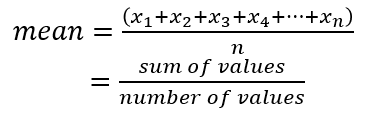
We use the symbols x ̅ to represent mean, ∑x means summationx or sum of variables x
Worked Example
Find the mean of the following set of numbers: 6, 7, 15, 14, 12, 8 11, 3
Sum of numbers, ∑▒x=6+7+15+14+12+8+11+3
=76
There are n=8 numbers
mean, x ̅=(∑x)/n=76/8=
=9.5
Worked Example
The mean of seven numbers is 96. If an eight number is added, the mean becomes 112. Find the eighth number
n=7, x ̅=96
(∑▒x)/7=96 → ∑▒x=96×7=672
Let the eighth number be x8.
Since there are now 8 numbers, the mean becomes
(∑▒x+x_8)/8=112, but ∑▒x=672
672+x8=896
x8=224
Mean of a frequency distribution
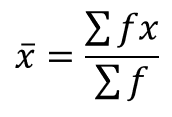
Given a frequency distribution where each value x occurs with frequency f.
To find the sum of values, we find the sum of the product f×x, that is, ∑▒f x
and when we divide this sum by the sum of frequency, ∑▒f, we get the mean
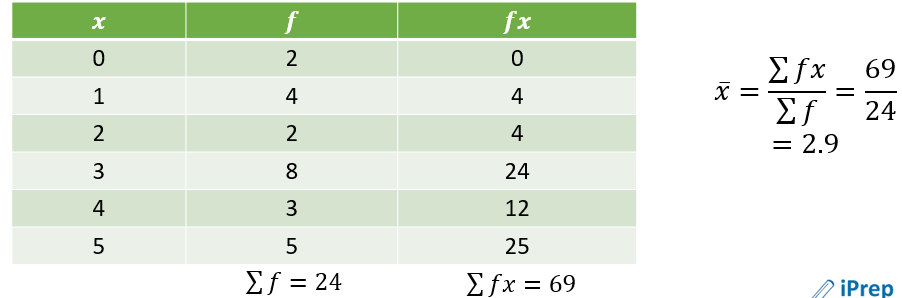
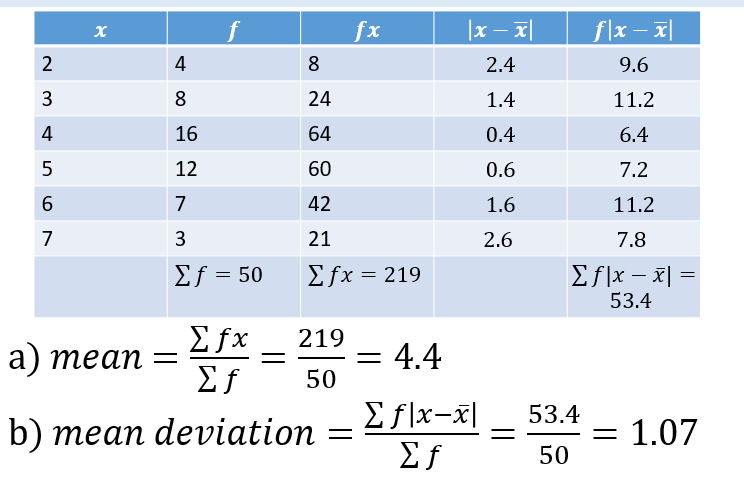
Worked Example: Find the mean of the data shown in the table below
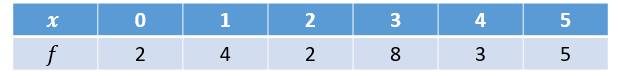
Convert to a vertical table and add another column fx
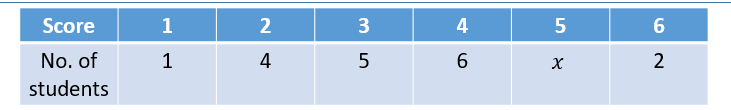
Worked Example: The table above shows the scores of a group of students in a test. If the average score is 3.5, find the value of x.
∑▒fx=(1″×” 1)+(2″×” 4)+(3″×” 5)+(4″×” 6)+(5″×” x)+(6×2)
∑▒fx=1+8+15+24+5x+12=60+5x
∑▒f=1+4+5+6+x+2=18+x
average=(∑▒fx)/(∑▒f)=(60+5x)/(18+x)=3.5
60+5x=3.5(18+x)
60+5x=63+3.5x
1.5x=3
x=2
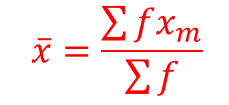
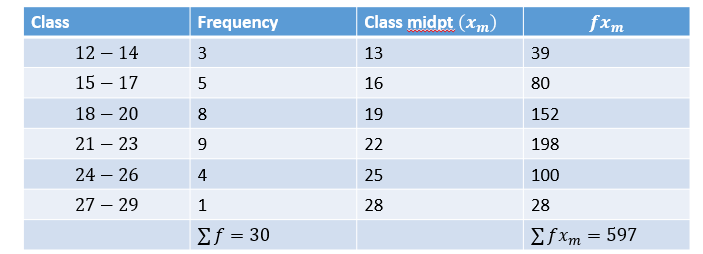
Mean of a grouped frequency distribution
To calculate the mean from a frequency distribution with grouped data, we use the central value (xm ) of each class to represent the value of x.
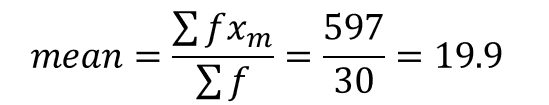
Example: Find the mean marks for the frequency distribution shown in the table
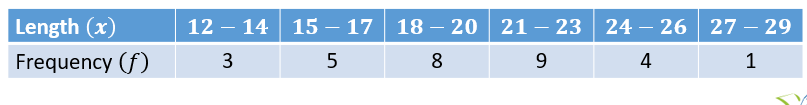
Method 1: Form the usual vertical table and a column for the class midpoint
Method 2: to avoid long multiplication or tedious work, we use an assumed mean or working mean chosen near the middle of the distribution
If we choose an assumed mean of 20, we add another column for the deviations from the assumed mean
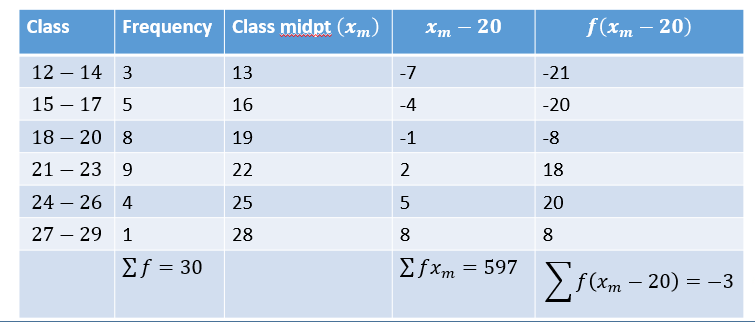
Mean of a frequency distribution
x ̅=x_a+(∑▒f(x_m-x_a ) )/(∑▒f)
where xa is the assumed mean
=20+(-3)/30
x ̅=20-0.1=19.9
Median
The median is a set of data is the middle value when the set is arranged in increasing or decreasing order
Consider the set of numbers 5, 6, 5, 7, 9, 4, 2, 9, 8.
If we arrange the numbers in increasing order;
2, 4, 5, 5, 6, 7, 8, 9, 9
The set of data contains 9 numbers and the middle number is the 5th. This is the number 6. Thus, median = 6
In general, if there are n-numbers, the median is the (n+1)/2 th number if n is odd
If there is an even set of numbers, the median is then the average of the two middle terms.
e.g. find the median of 2, 3, 7, 3, 4, , 8, 9, 9, 4, 5, 3, 2, 4 and 5
Rearranging them in increasing order
2, 2, 3, 3, 3, 4, 4, 4, 5, 5, 5, 5, 7, 8, 9, 9
“median”=(4+5)/2=4.5
Median of a frequency distribution
From the table below, find the median of the data

∑▒f=1+4+3+8+2+5=23
The middle value is (23+1)/2 th number, i.e. the 12th number
Counting from the left in the frequency row, the 12th number will be one of the eight 3s.
The median is 3.
NOTE that the median is not the frequency 8, but the score or number 3
Median of a grouped data
Earlier on, we considered the median from a histogram – the score which divides the histogram into two equal parts.
We can develop a formula for calculating the median without having to draw histograms.
Let’s use an example to derive the formula
Example: The frequency distribution table gives the marks scored by students in a mathematics test. Find the median mark
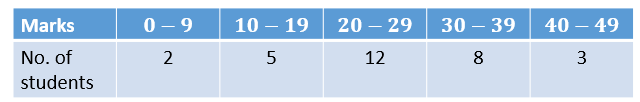
∑▒f=2+5+12+8+3=30
The median is the (30+1)/2 th or the 15 1/2 th mark
Counting from the left on the frequency line, we see that the 15 1/2 th mark will fall on the class 20-29
After the first 7 (2+5) students on the frequency line, there are 15 1/2-7=8 1/2 values to reach before getting to the median mark.
The median class stretches from 19.5 to 29.5, has class width of 10 (29.5-19.5) and a frequency of 12.
Our aim now is to find the class mark in the median class that corresponds to the 8 1/2 median frequency
By proportion, the median will be (8 1/2)/12×10=7.08 after the left hand boundary

∴median=19.5+7.08=26.58
We can now put forward a general formula for median
lower C.B+{((∑▒f)/2-∑▒f before median class)/(frequency of median class)}×class”-” width
L+{((∑▒f)/2-∑▒f_l )/f_median }C
Mode
The mode is the value which occurs most frequently.
Practice Question
Find the mean, median and mode of the data set below and comment on your results
5 7 8 7 5 4 0 9 10 6 4 8 8 9 5 6 3 2 4 4 6 5 5 7 6 7 5 6 9 2 7 7 6 3 5 5 6 8 7 5 2 1 6 8 5 4 4 3 3
Cumulative Frequency, Quartiles and Percentiles
Cumulative frequency and its uses helps us to find the median easily as it saves time instead of arranging a large number of marks in order of size.
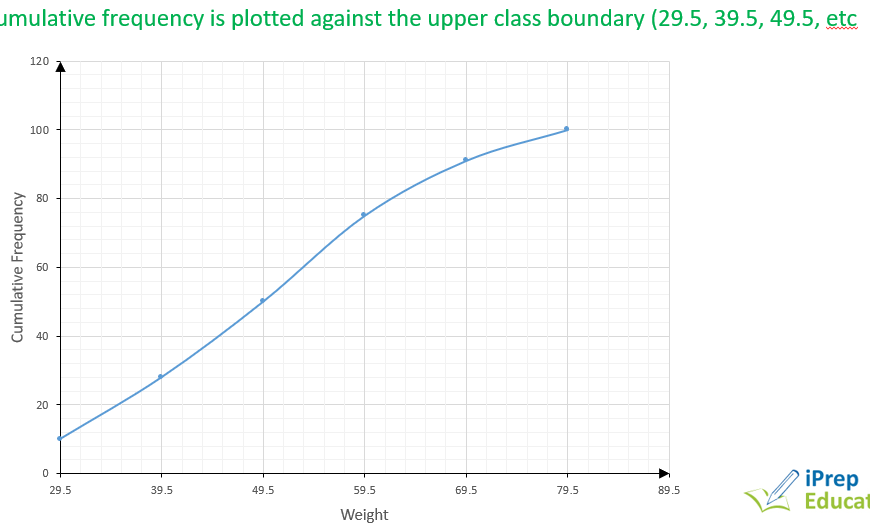
We add the total of the previous frequencies to obtain the cumulative frequency of a class and with this, we can draw a cumulative frequency curve, called an ogive.
Worked Example
The frequency distribution of the weight of 100 participants in a high jump competition is as shown below
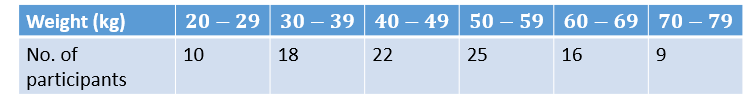
a)Construct the cumulative frequency table
b)Draw the cumulative frequency curve
Cumulative frequency table
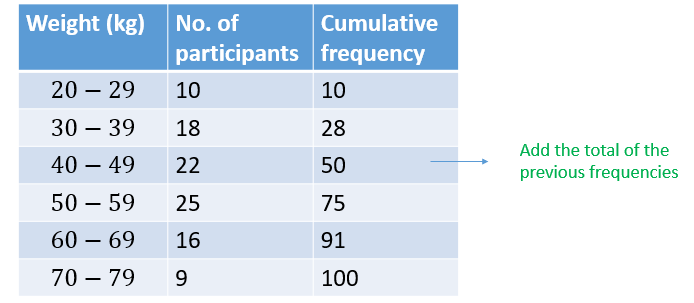
The final frequency must therefore be the total frequency of the distribution
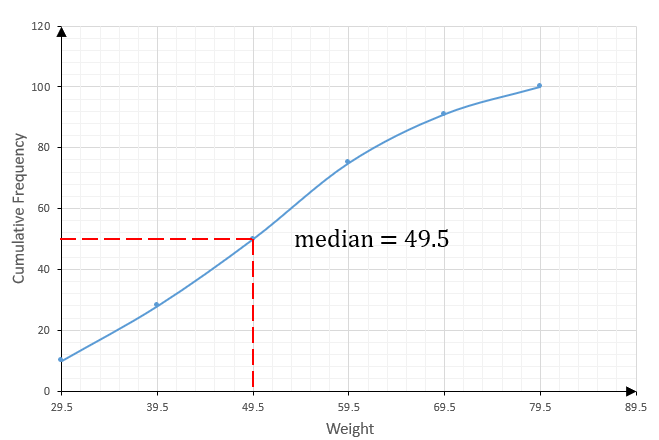
Deductions from the cumulative frequency curve:
1. Median. There are 100 participants. The median is the (100+1)/2 th or 50 1/2 mark
Deductions from the cumulative frequency curve:
Deductions from the cumulative frequency curve:
2. Quartiles: We define the lower quartile (Q_1 ) as one quarter of the curve, that is, the value that corresponds to 1/4 (n+1)th score, where n is the total frequency.
Similarly, the upper quartile (Q_3 ) is three-quarters of the curve, that is, the value that corresponds to 3/4 (n+1)th score
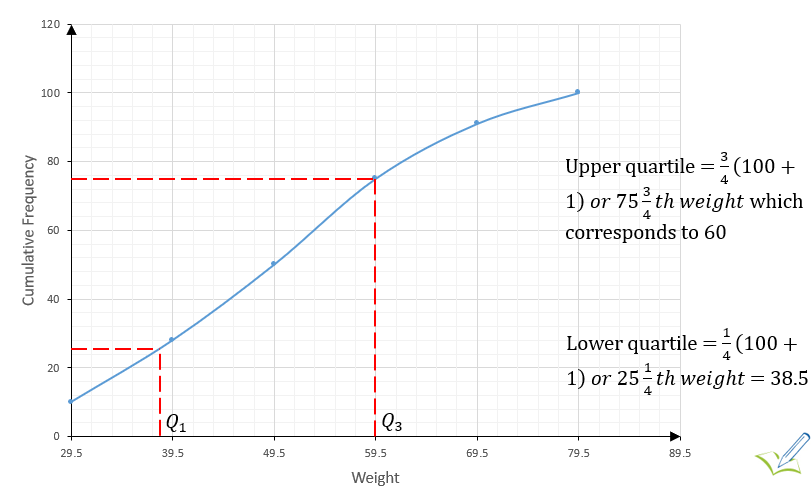
Deductions from the cumulative frequency curve:
The second quartile Q2 is the median
Interquartile range = Q3-Q1
The semi-interquartile range Q is defined as
Q=(Q3-Q1)/2
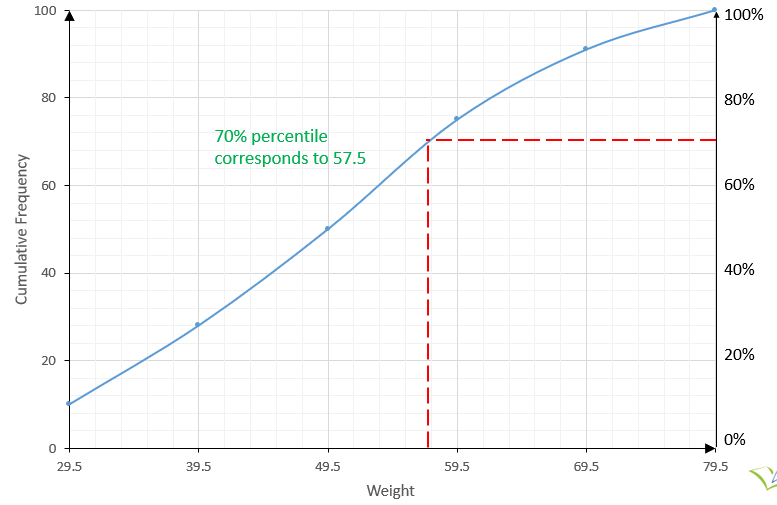
3. Percentiles
If we divide the vertical axis into percentage points, we will be able to divide the data into more points than the use of quartiles. This type of division is called percentiles.
Measures of Central Tendency: mean, median & mode
Sometimes, depending on the nature of the distribution, the median can be used as the average.
In symmetrical distributions, the mean and the median will be close together.
The median is not affected by abnormal values and is easier to calculate from the frequency table, unlike the mean.
However, the mean gives a better understanding of the average and is useful for further statistical analysis.
Practice
The table shown gives the mark distribution in an aptitude test.

a)Draw a cumulative frequency curve for the test
b)Find the median and semi-interquartile range
c)Estimate the percentage of the candidates that obtained more than 56 marks
d)Which mark is at the 70th percentile?
Measures of Dispersion
This is also referred to as measures of variation or spread. They measure the degree to which a certain distribution spreads. If we consider the two sets of values
1) 16, 3, 14, 15, 18
2) 21, 8, 26, 26, 12, 9
They both have the same mean of 15.2, but the values in the first set are more closely packed than the second. We therefore need some kind of measurement that indicates the amount of spread of these values about the mean
The three common measures of dispersion are
(i)range
(ii)mean deviation standard deviation
Range
This is the simplest way to indicate the spread or dispersion. It is given as
Range = highest value – least value
Example: What is the range of the distribution 5, 2, 12, 8, 3, 17
Range = 17-2=15
The range does not use all of the available information except the extreme values.
This measure is an advantage when dealing with quality control as it becomes very sensitive to something going wrong on a production line.
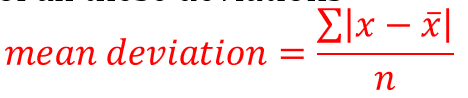
Mean Deviation
This is the mean of all the absolute values of the deviation of each value from the actual mean in the data.
In other words, we
•find the deviation (subtraction) of the mean from each value in the data
•find the absolute values (magnitude only)
•find the mean of all these deviations
Worked Example
Find the mean deviation of the set of values 1, 3, 5, 9, 12
mean x ̅=(1+3+5+9+12)/5=6

Worked Example
A survey was carried out to find the number of children above 2 years in homes within a locality. The table shows the findings
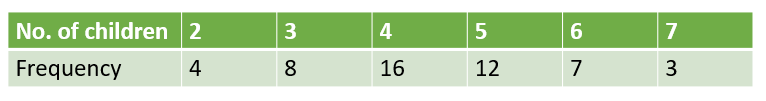
a)Find the mean number of children
b)Find the mean deviation
Worked Example
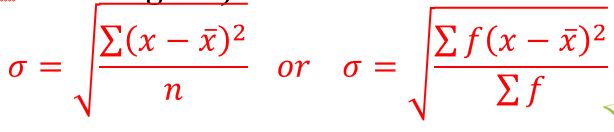
Standard Deviation (s.d)
This is the most widely used measure of dispersion in statistics. It is found using the following steps
1.The mean x ̅ is first calculated from the values of x
2.The deviation of each of these values from the mean (x-x ̅) is found and thereafter the square (x-x ̅ )^2 is calculated
3.The average of the square deviations gives the variance, that is, (∑▒(x-x ̅ )^2 )/n
4.The square root of the variance gives the standard deviation, σ (greek letter “sigma”)
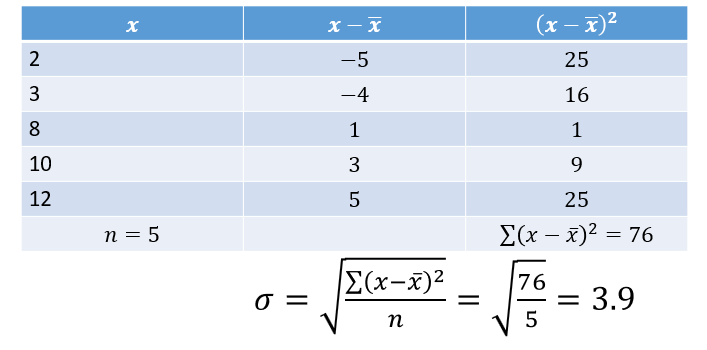
Worked Example
Find the standard deviation of 2, 3, 8, 10 and 12.
mean x ̅=(2+3+8+10+12)/5=35/5=7
Practice
1. Find the range of the following distributions
a)6, 10, 4, 12, 16, 14, 2, 16
b)37.8kg, 39kg, 32.8kg, 39.2kg, 38.7kg
2. The number of orange fruits in some orange trees are 25, 32, 36, 28, 38, 40, 30, 35, 40, and 30. Calculate the mean and standard deviation
Practice
1. Find the range of the following distributions
a)6, 10, 4, 12, 16, 14, 2, 16
b)37.8kg, 39kg, 32.8kg, 39.2kg, 38.7kg
2. The number of orange fruits in some orange trees are 25, 32, 36, 28, 38, 40, 30, 35, 40, and 30. Calculate the mean and standard deviation
PROBABILITY
Introduction
Probability is a measure of the level of certainty for an event to occur.
It is a numerical estimate of the likelihood of a certain event to occur.
If 7 balls are put in a bag, out of which 4 are black and 3 are red, and if a ball is now picked randomly, the probability a red ball is picked (the event) from the bag of seven balls (the sample space) is 3 out of 7, that is 3/7.
Probability
In general, the probability of an event E occurring is denoted as P(E) and given as

Probability is expressed as a fraction or decimal and is between 0 and 1, i.e. 0≤P(E)≤1
When P(E)=1, it means that the event is certain to happen. For example, the probability that a man will die someday is 1.
If P(E)=0, it means the event cannot happen.
For example, the probability of obtaining an apple fruit from an orange seed is 0
The basic rule of probability is that it is certain a particular event E will occur OR it will not occur.
So the sum of the probability that an event will occur and the probability that it will not occur is 1.
P(E) + P(E will not occur ) =1
Thus, P(E will not occur)=1-P(E)
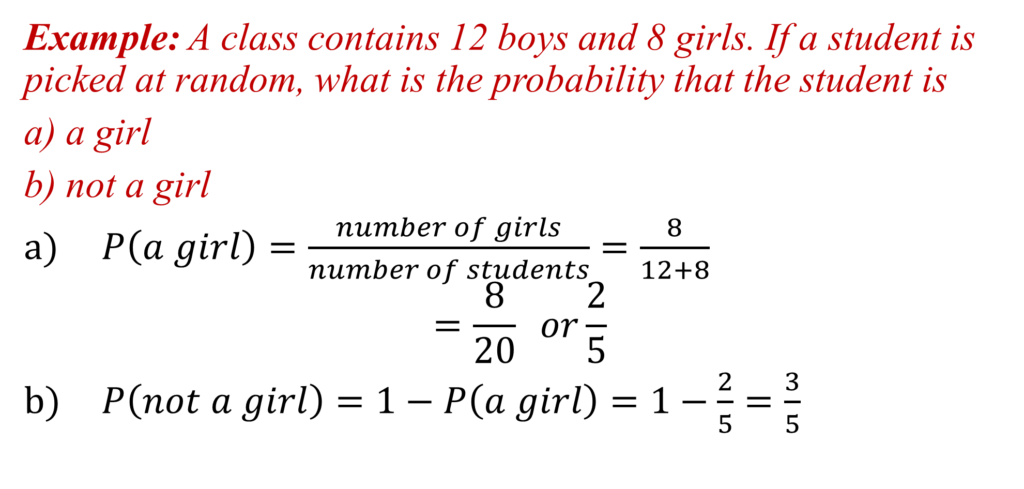
Example: An unbiased die is rolled 100 times and the outcome is tabulated as follows
| Number | 1 | 2 | 3 | 4 | 5 | 6 |
| Frequency | 13 | 15 | 22 | 14 | 20 | 16 |
What is the probability of obtaining a 5?
Total frequency = 13+15+22+14+20+16=100
P(obtaining a 5)=20/100
=1/5
Mutually Exclusive Events
If events A, B, C, D,… are mutually exclusive, it means that only one event (either A or B or C or D) can occur at a time of random sampling.
E.g. in a toss of a coin, it is either a HEAD or a TAIL that occurs. Both of them cannot occur at the same time.
Similarly, when drawing a card from a pack, the event of drawing out an ACE and also a KING cannot happen at the same time.
However, if we consider two events such as obtaining an even number or obtaining a multiple of 3 when a die is rolled once,
we see that the two events are not mutually exclusive because obtaining a 6 is common to the two events.
Hence two sets are said to be mutually exclusive if they have no common elements.
In general, if A and B are exclusive events, the probability of A or B, is given by
P(A or B)=P(A)+P(B)
In mutually exclusive events, the probabilities are added. Look out for the keywords or/either
A die is rolled once. What is the probability of obtaining a prime number or a number greater than 5?
A die has 6 faces labelled 1 – 6
n(Prime numbers obtainable) = n(2, 3, 5)=3
n(numbers greater than 5) = n(6)=1
Number of possible outcomes = 6
P(prime numbers or number greater than 5)=
P(prime numbers)+P(numbers greater than 5)
3/6+1/6=4/6 or 2/3
Independent Events
Two events are said to be independent when the occurrence of one event does not affect the occurrence of the other.
For example, if we roll a die twice, the event of having a 6 in the first roll does not affect having another 6 in the second roll.
Suppose a bag contains 4 red balls and 3 blue balls. A ball is picked at random and replaced. Another ball is picked at random. What the probability that two red balls were picked?
The probability that a red was picked the first time is 4/7. As the ball is replaced, the random sampling is reset.
Independent Events
The probability of picking a red ball a second time is also 4/7. The two events are independent and their probabilities are multiplied
p(picking 2 red balls)=4/7×4/7=16/49
If A and B are two independent events, the probability of A and B is given as
P(A and B)=P(A)×P(B)
Look out for the keywords and/both
Useful tips in probability
•A coin has 2 faces: HEAD or TAIL
•A die (plural: dice) has 6 faces: 1, 2, 3, 4, 5, 6
•A pack of playing cards contains 52 cards consisting of
§ 26 red cards, 26 black cards
§ 13 hearts, 13 diamonds, 13 spades and 13 club cards
§ 4 aces, 4 twos, …up to 4 tens, then 4 jacks, 4 queens, 4 kings
Example: A pack of 52 playing cards is shuffled and a card is picked at random. Find the probability that it is
a)an ace
b)a red card
c)a diamond or a heart
d)a red spade
e)a two diamond

PRACTICE
1.In a box, there are two red balls and three blue balls of equal sizes. A ball is selected at random from the box. Find the probability that the ball is
a) Red b) blue c) blue or red
2.Two cards are picked at random from a pack of 52 playing cards, one at a time with replacement. What is the probability that the cards are
a) both aces b) both spades c) both hearts or both spades
Probability DIstribution
Let’s discuss the Probability Table and Probability Tree
Example: If two coins are rolled. What is the probability of obtaining
a)two heads b) a head and a tail
Probability Table: this is a table containing all the possible outcomes
| H | T | |
| H | HH | HT |
| T | TH | TT |
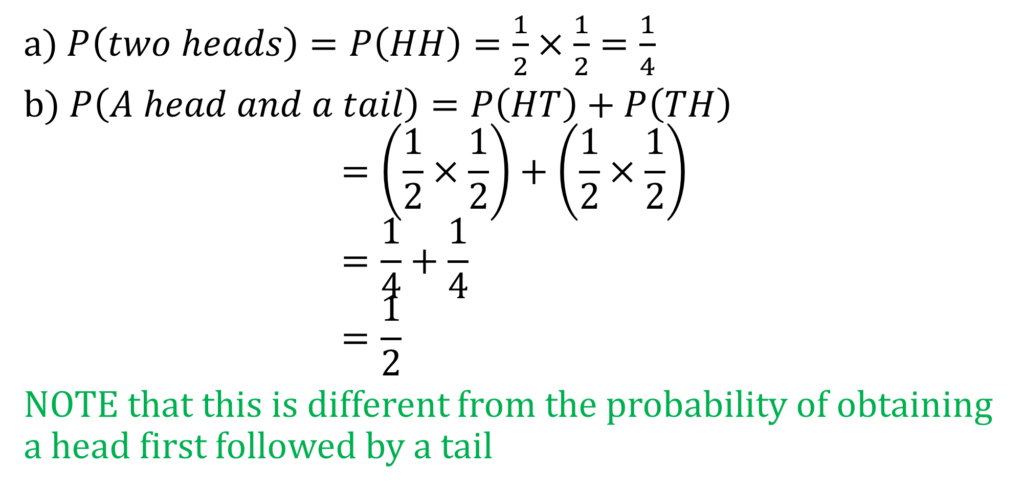
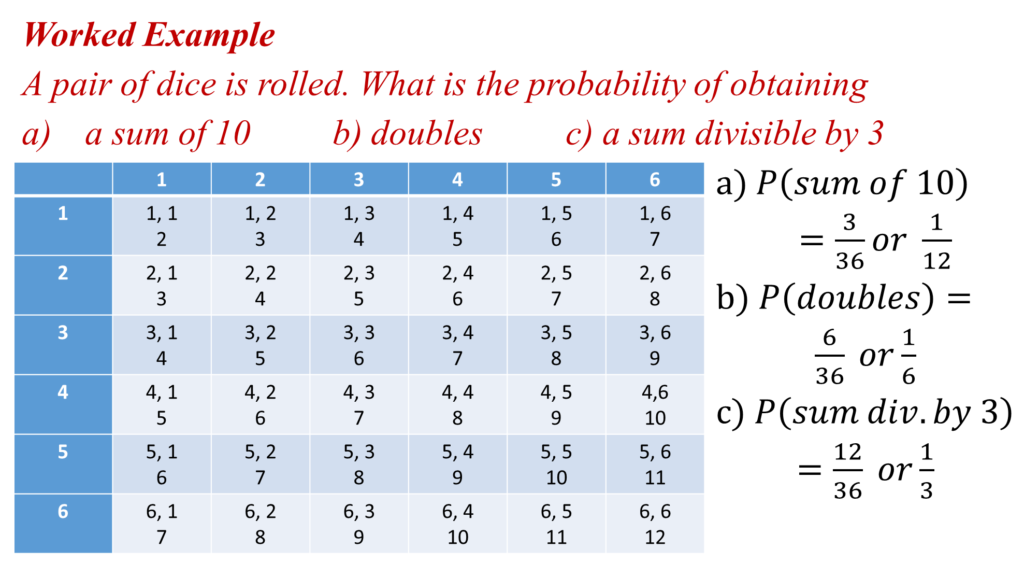
Probability Tree
The probability tree is specially suited for “without replacement” type of problems, or to put it more technically, dependent events
Example: A box contains 5 blue balls and 4 white balls all identical. Two balls are selected without replacement. What is the probability that they are
a)both blue
b)of different colours
c)they are of the same colour

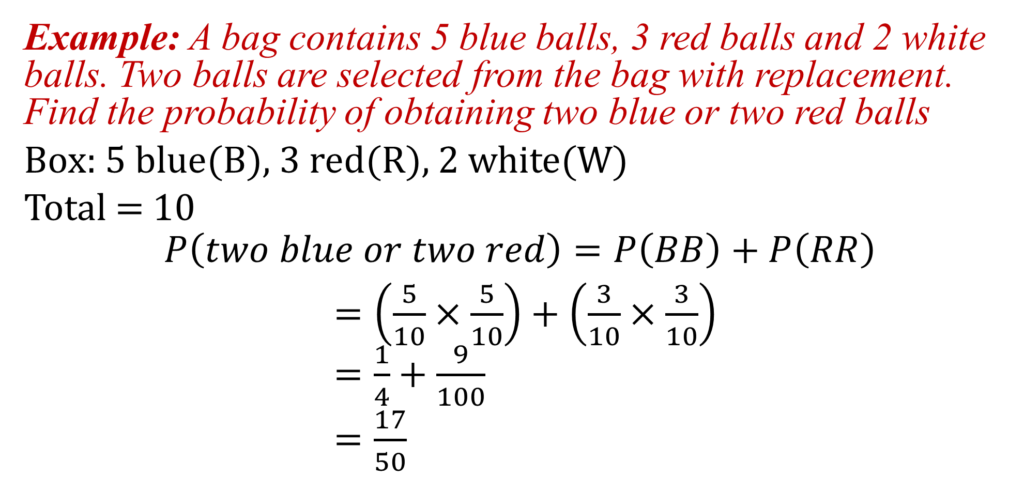
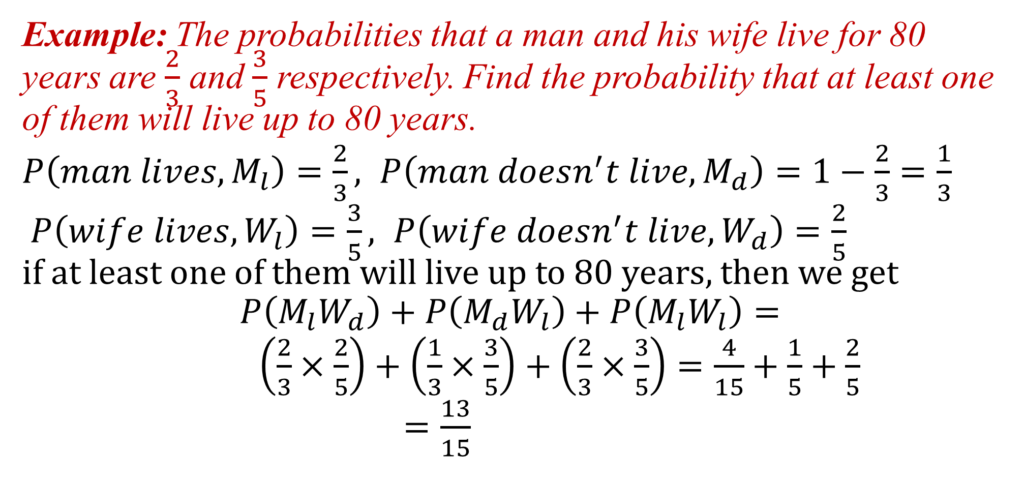
PRACTICE
1. The probabilities of selecting a boy and a girl from a class of students are 3/5 and 2/5 respectively. Two students are chosen to form a committee. Assuming that the probabilities remain unchanged, find the probability of selecting a committee composed of a boy and a girl.
2. A coin is tossed three times
a)Draw a tree diagram showing the outcomes
b)Find the number of outcomes which have two tails
c)Find the probability of obtaining two tails and one head
d)Find the probability of obtaining at least one tail